34 Visualising phylogenies with ggtree
- Visualise and annotate a S. pneumoniae phylogenetic tree with the R package
ggtree.
34.1 Plotting phylogenetic trees with R
Although trees can be visualised with software such as FigTree or Microreact, these tools can be limited in their customisation options. In particular, to produce publication-ready figures, where you may want to produce trees that fit a certain size, resolution, font size, etc.
An alternative for tree visualisation is the R package ggtree, which provides many functions to customise your trees. It can produce trees in a range of layouts, as well as display additional information (such as metadata) alongside the tree. This includes basic configuration such as colouring the branches and tips of the tree, to more advanced displays such as adding heatmaps and barplots aligned with the tree branches.
The package supports common tree formats (such as Newick, produced by IQ-Tree), making it easy to integrate into your R analysis workflows. In the following practical/exercise, we will demonstrate the basic usage of this package, to visualise the tree and MLST typing we produced for S. pneumoniae. However, the package developer has written a book, which offers an extensive manual to using this package: Data Integration, Manipulation and Visualization of Phylogenetic Trees.
- Open the script
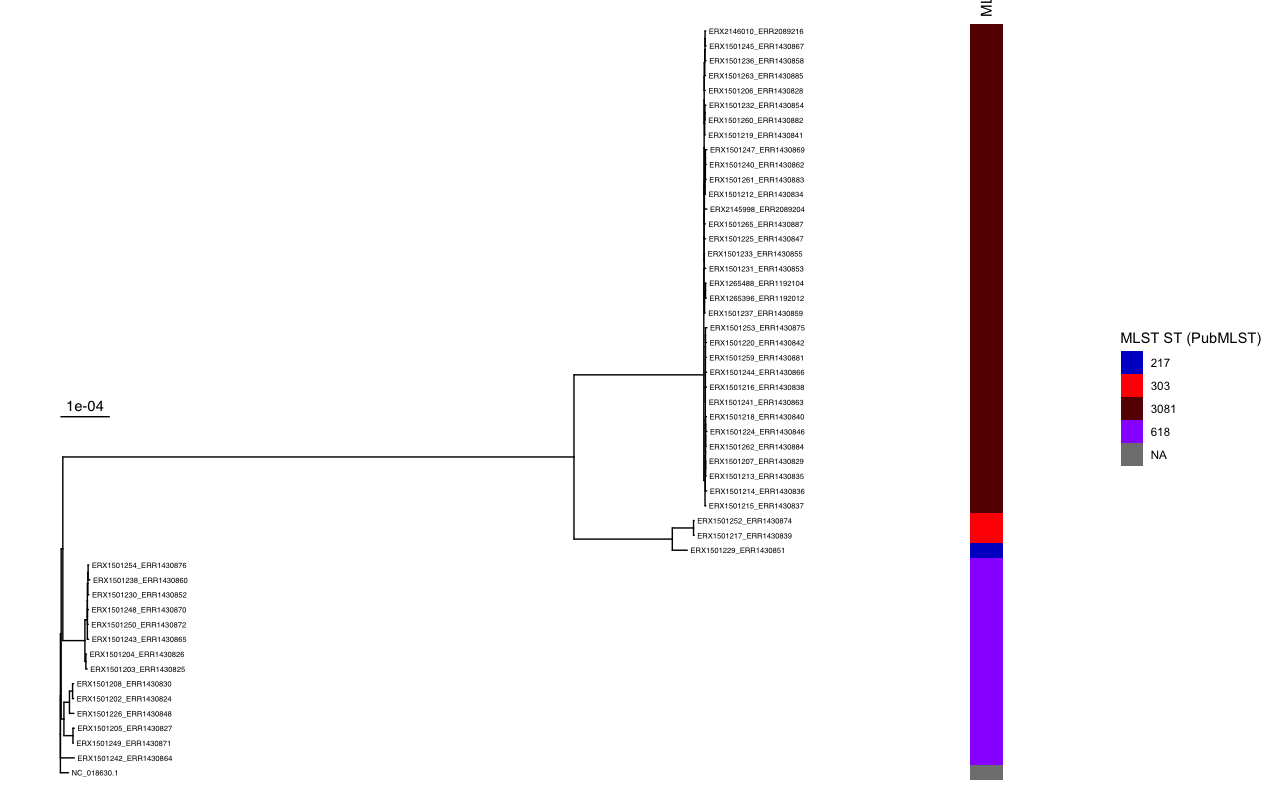
06-plot_phylogeny.Rin thescriptsdirectory in RStudio. - Run the script line-by-line to generate the annotated phylogenetic tree.
The resulting tree should look similar to this:
34.2 Summary
- ggtree is a highly customisable R package for generating publication quality images of phylogenetic trees.