23 Assembly Quality
- List common indicators to assess the quality of a genome assembly.
- Discuss general assembly statistics that can be used to assess genome contiguity and completeness.
23.1 Assembly quality
Before we do any further analyses, we need to assess the quality of our genome assemblies. The quality of a genome assembly can be influenced by various factors that impact its accuracy and completeness, from sample collection, to sequencing, to the bioinformatic analysis. To assess the quality of an assembly, several key indicators can be examined:
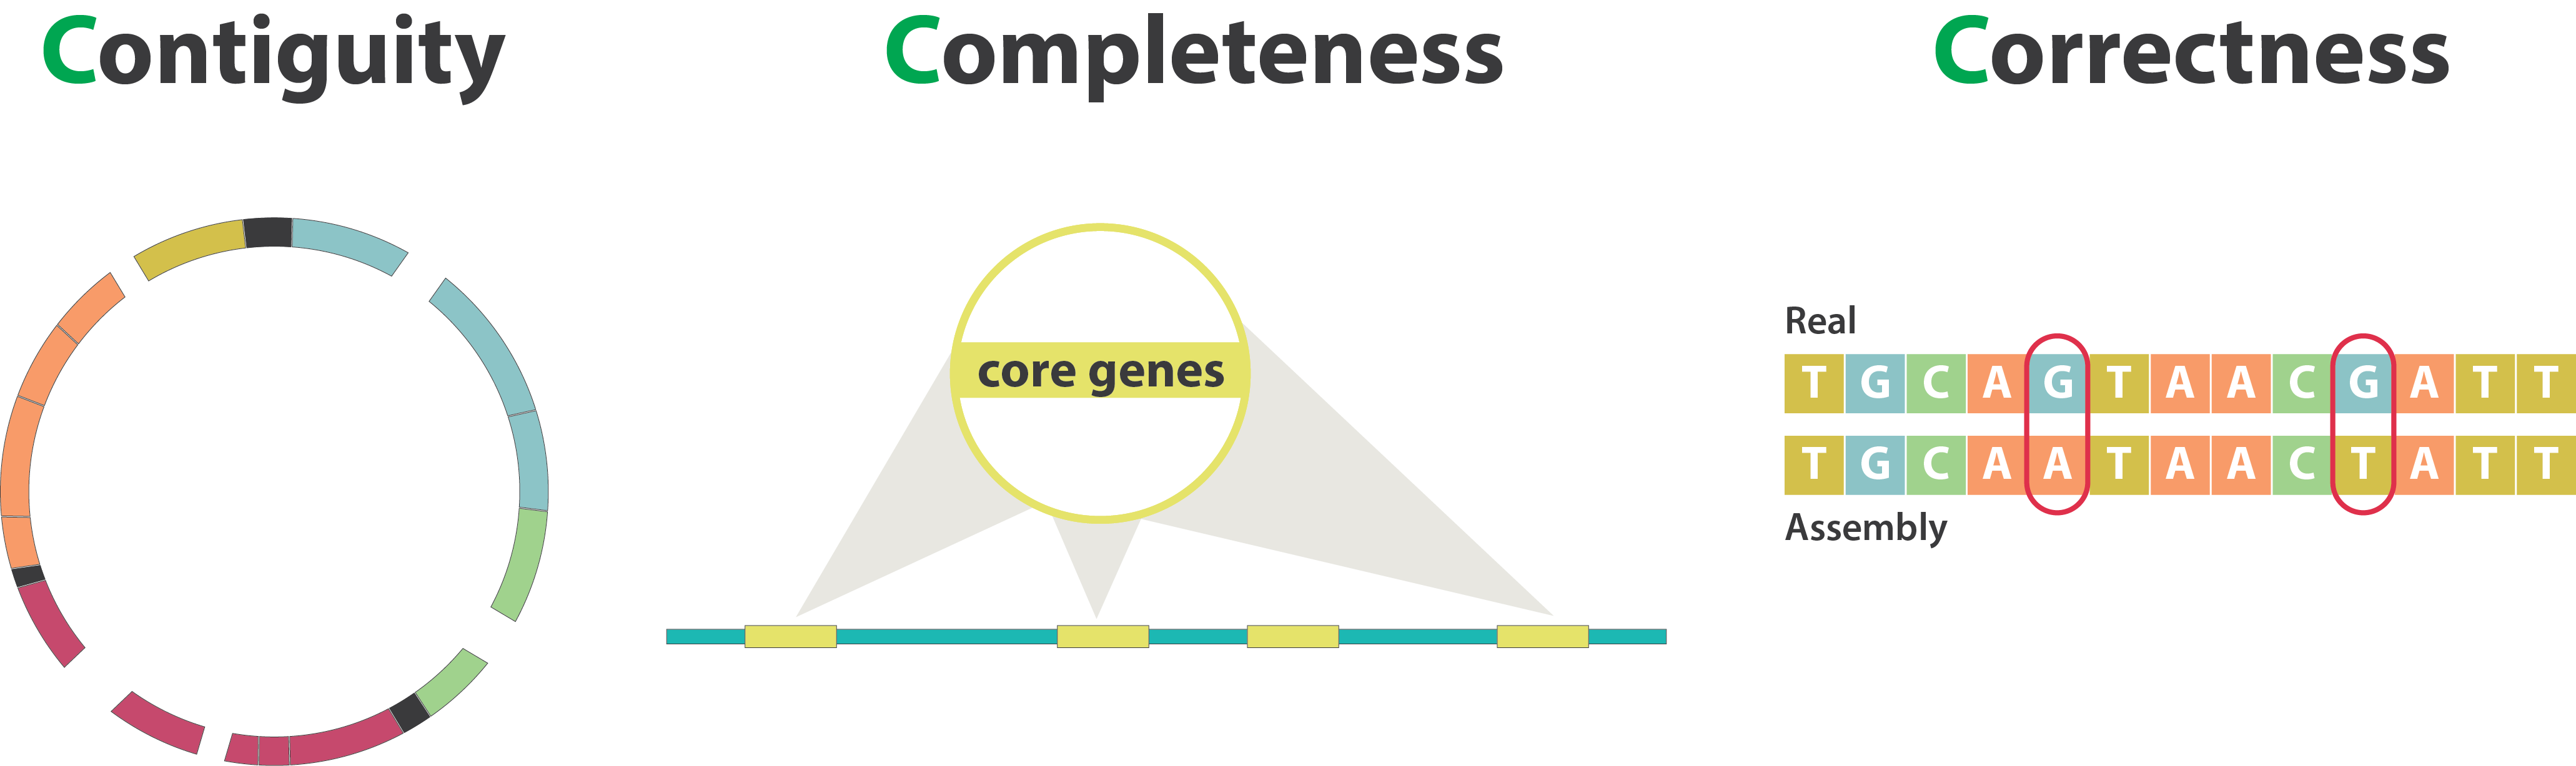
- Completeness: the extent to which the genome is accurately represented in the assembly, including both core and accessory genes.
- Contiguity: refers to how long the sequences are without gaps. A highly contiguous assembly means that longer stretches are assembled without interruptions, the best being chromosome-level assemblies. A less contiguous assembly will be represented in more separate fragments.
- Contamination: the presence of DNA from other species or sources in the assembly.
- Accuracy/correctness: how closely the assembled sequence matches the true sequence of the genome.
Evaluating these factors collectively provides insights into the reliability and utility of the genome assembly for further analysis and interpretation.
For the purposes of time, we didn’t run bacQC on our Staphylococcus aureus dataset. However, we’ve provided the results for our contamination check using Kraken 2 in preprocessed/bacqc/metadata/species_composition.tsv along with the other summary results produced by bacQC.
Since our samples are taken from a published dataset, we expected little or no contamination, but this is not always the case. So, it is important still to do quality control of data taken from public databases, to ensure that it is suitable for the analysis you’re running. For instance, contamination with another Staphylococcus species or even another bacterial species altogether would have affected the accuracy of our assemblies.
Let’s now turn to some of the other metrics to help us assess our assemblies’ quality.
23.2 Contiguity
One of the outputs from running assembleBAC is a summary file containing the Quast outputs for each sample. This file can be found in preprocessed/assemblebac/metadata/transposed_report.tsv.
You can open it with a spreadsheet software such as Excel from our file browser (for brevity, we only show the columns of most interest):
Assembly    # contigs (>= 0 bp) # contigs (>= 1000 bp)  Total length (>= 0 bp)  Largest contig  N50
ERX3876932_ERR3864879_T1_contigs    77  40  2848635 484893  109559
ERX3876949_ERR3864896_T1_contigs    70  18  2683262 493468  251833
ERX3876930_ERR3864877_T1_contigs    84  20  2729135 557153  251805
ERX3876908_ERR3864855_T1_contigs    45  13  2717933 792936  707553
ERX3876945_ERR3864892_T1_contigs    30  9   2670961 1351816 1351816
The columns are:
- Assembly - our sample ID.
- # contigs (>= 0 bp) - the total number of contigs in each of our assemblies.
- # contigs (>= 1000 bp) - the total number of contigs > 1000 bp in each of our assemblies.
- Total length (>= 0 bp) - the total length of our assembled fragments.
- Largest contig - the largest assembled fragment.
- N50 - a metric indicating the length of the shortest fragment, from the group of fragments that together represent at least 50% of the total genome. A higher N50 value suggests better contig lengths.
To interpret these statistics, it helps to compare them with other well-assembled Staphylococcus aureus genomes. For example, let’s take the first MRSA genome that was sequenced, N315, as our reference for comparison. This genome is 2.8 Mb long and is composed of a single chromosome.
We can see that all of our assemblies reached a total length of around 2.7 to 2.9 Mb, which matches the expected length from our reference genome. This indicates that we managed to assemble most of the expected genome. However, we can see that there is a variation in the number of fragments in the final assemblies (i.e. their contiguity). For instance, isolates ERX3876936_ERR3864883 and ERX3876945_ERR3864892 were assembled to a small number of fragments each, suggesting good assemblies. For several other isolates our assemblies were more fragmented, in particular ERX3876939_ERR3864886 which had more than 200 fragments. This indicates less contiguous sequences.
23.3 Completeness
We now turn to assessing genome completeness, i.e. whether we managed to recover most of the known Staphylococcus aureus genome, or whether we have large fractions missing. We can assess this by using CheckM2 which was run as part of the assembleBAC pipeline. This tool assesses the completeness of the assembled genomes based on other similar organisms in public databases, in addition to contamination scores. The output file from assembleBAC summarising the CheckM2 results is a tab-delimited file called checkm2_summary.tsv. This file can be found in preprocessed/assemblebac/metadata/ and can be opened in a spreadsheet software such as Excel. Here is an example result (for brevity, we only show the columns of most interest):
Name    Completeness    Contamination   Genome_Size GC_Content  Total_Coding_Sequences
ERX3876905_ERR3864852_T1_contigs    100 0.22    2743298 0.33    2585
ERX3876907_ERR3864854_T1_contigs    100 0.49    2900162 0.33    2765
ERX3876908_ERR3864855_T1_contigs    100 0.07    2717933 0.33    2534
ERX3876909_ERR3864856_T1_contigs    100 0.17    2854371 0.33    2711
ERX3876929_ERR3864876_T1_contigs    100 0.1 2675834 0.33    2464
These columns indicate:
- Name - our sample name.
- Completeness - how complete our genome was inferred to be as a percentage; this is based on the machine learning models used and the organisms present in the database.
- Contamination - the percentage of the assembly estimated to be contaminated with other organisms (indicating our assembly isn’t “pure”).
- Genome_Size - how big the genome is estimated to be, based on other similar genomes present in the database. The N315 is 2.8 Mb in total, so these values make sense.
- GC_Content - the percentage of G’s and C’s in the genome, which is relatively constant within a species. The S. aureus GC content is approximately 33%, so again these values make sense.
- Total_Coding_Sequences - the total number of coding sequences (genes) that were identified by CheckM2. The N315 indicates annotated genes, so the values obtained could be overestimated.
From this analysis, we can assess that our genome assemblies are good quality, with 100% of the genome assembled for all our isolates. It is worth noting that the assessment from CheckM2 is an approximation based on other genomes in the database. In diverse species such as S. aureus the completeness may be underestimated, because each individual strain will only carry part of the pan-genome for that species.
23.4 Accuracy
Assessing the accuracy of our genome includes addressing issues such as:
- Repeat resolution: the ability of the assembly to accurately distinguish and represent repetitive regions within the genome.
- Structural variations: detecting large-scale changes, such as insertions, deletions, or rearrangements in the genome structure.
- Sequencing errors: identifying whether errors from the sequencing reads have persisted in the final assembly, including single-nucleotide errors or minor insertions/deletions.
Assessing these aspects of a genome assembly can be challenging, primarily because the true state of the organism’s genome is often unknown, especially in the case of new genome assemblies.
23.5 Summary
- Key aspects to evaluate an assembly quality include:
- Contiguity: how continuous the final assembly is (the best assembly would be chromosome-level).
- Completeness: whether the entire genome of the species was captured.
- Common indicators for evaluating the contiguity of a genome assembly include metrics like N50, fragment count and total assembly size.
- Specialised software tools, like QUAST and CheckM2, enable the assessment of genome completeness and contamination by comparing the assembly to known reference genomes and identifying missing or unexpected genes and sequences.