28 Visualising phylogenies 2
TipLearning Objectives
- Visualise and annotate your S. aureus tree with Microreact.
- Explore the large number of features in Micoreact that can be used to enrich your tree visualisations.
In the Visualising phylogenies chapter we used Microreact to visualize the phylogenetic tree of Namibian TB isolates. We’re going to do the same with the S.aureus phylogeny and metadata but use some of the other features in Microreact we didn’t use before.
First, copy
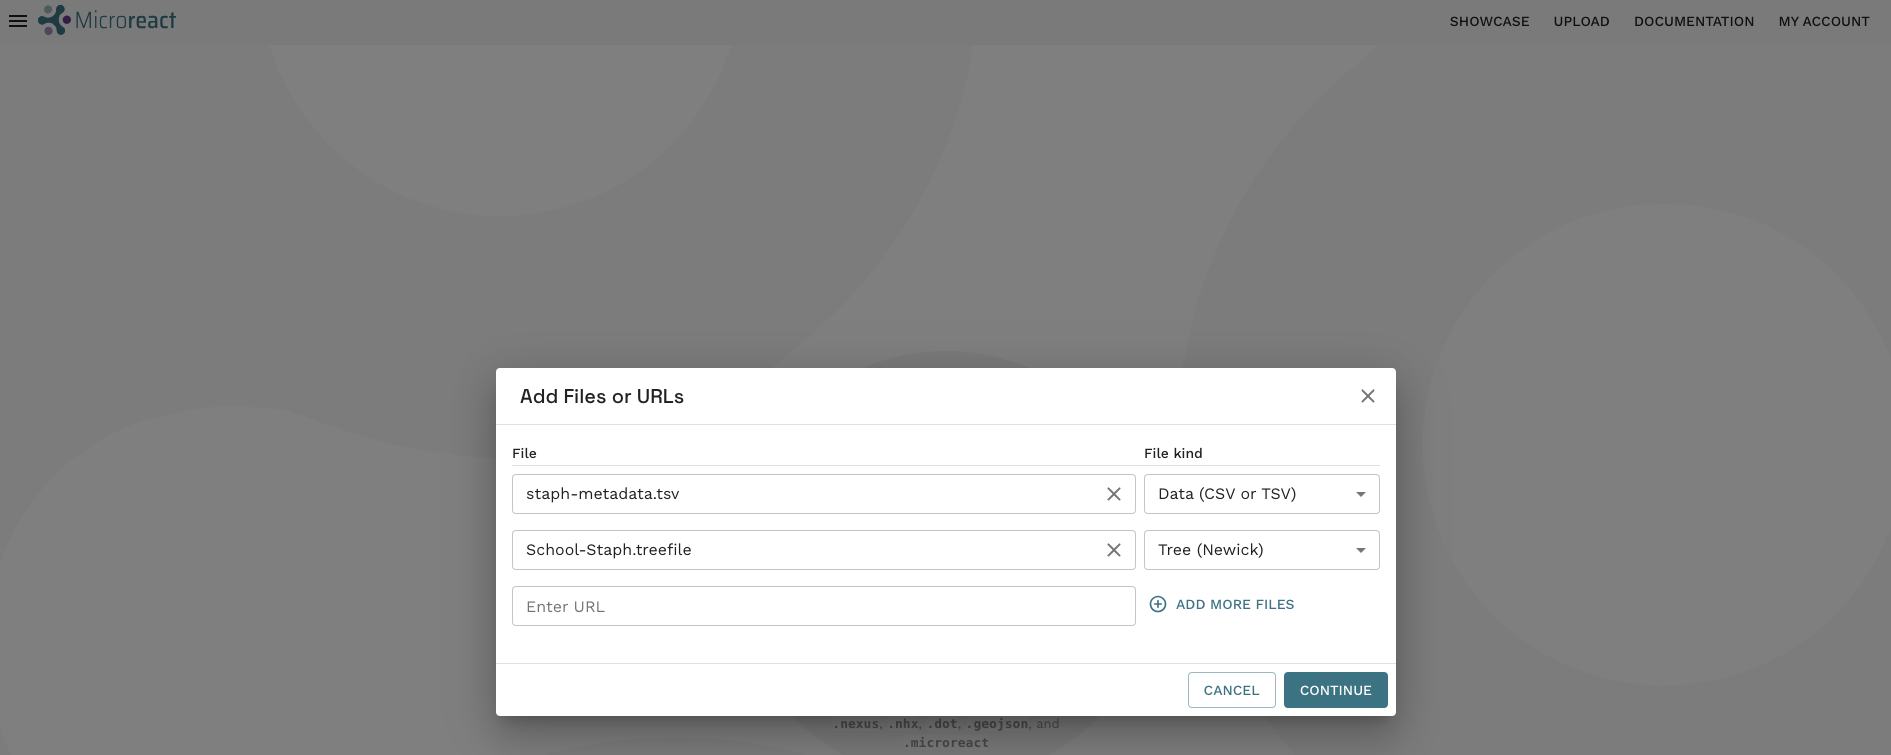
School_Staph.treefileto the analysis directory so that it’s in the same location asStaph_metadata.tsv:cp preprocessed/iqtree/School_Staph.treefile .Upload the two files to
Microreact:
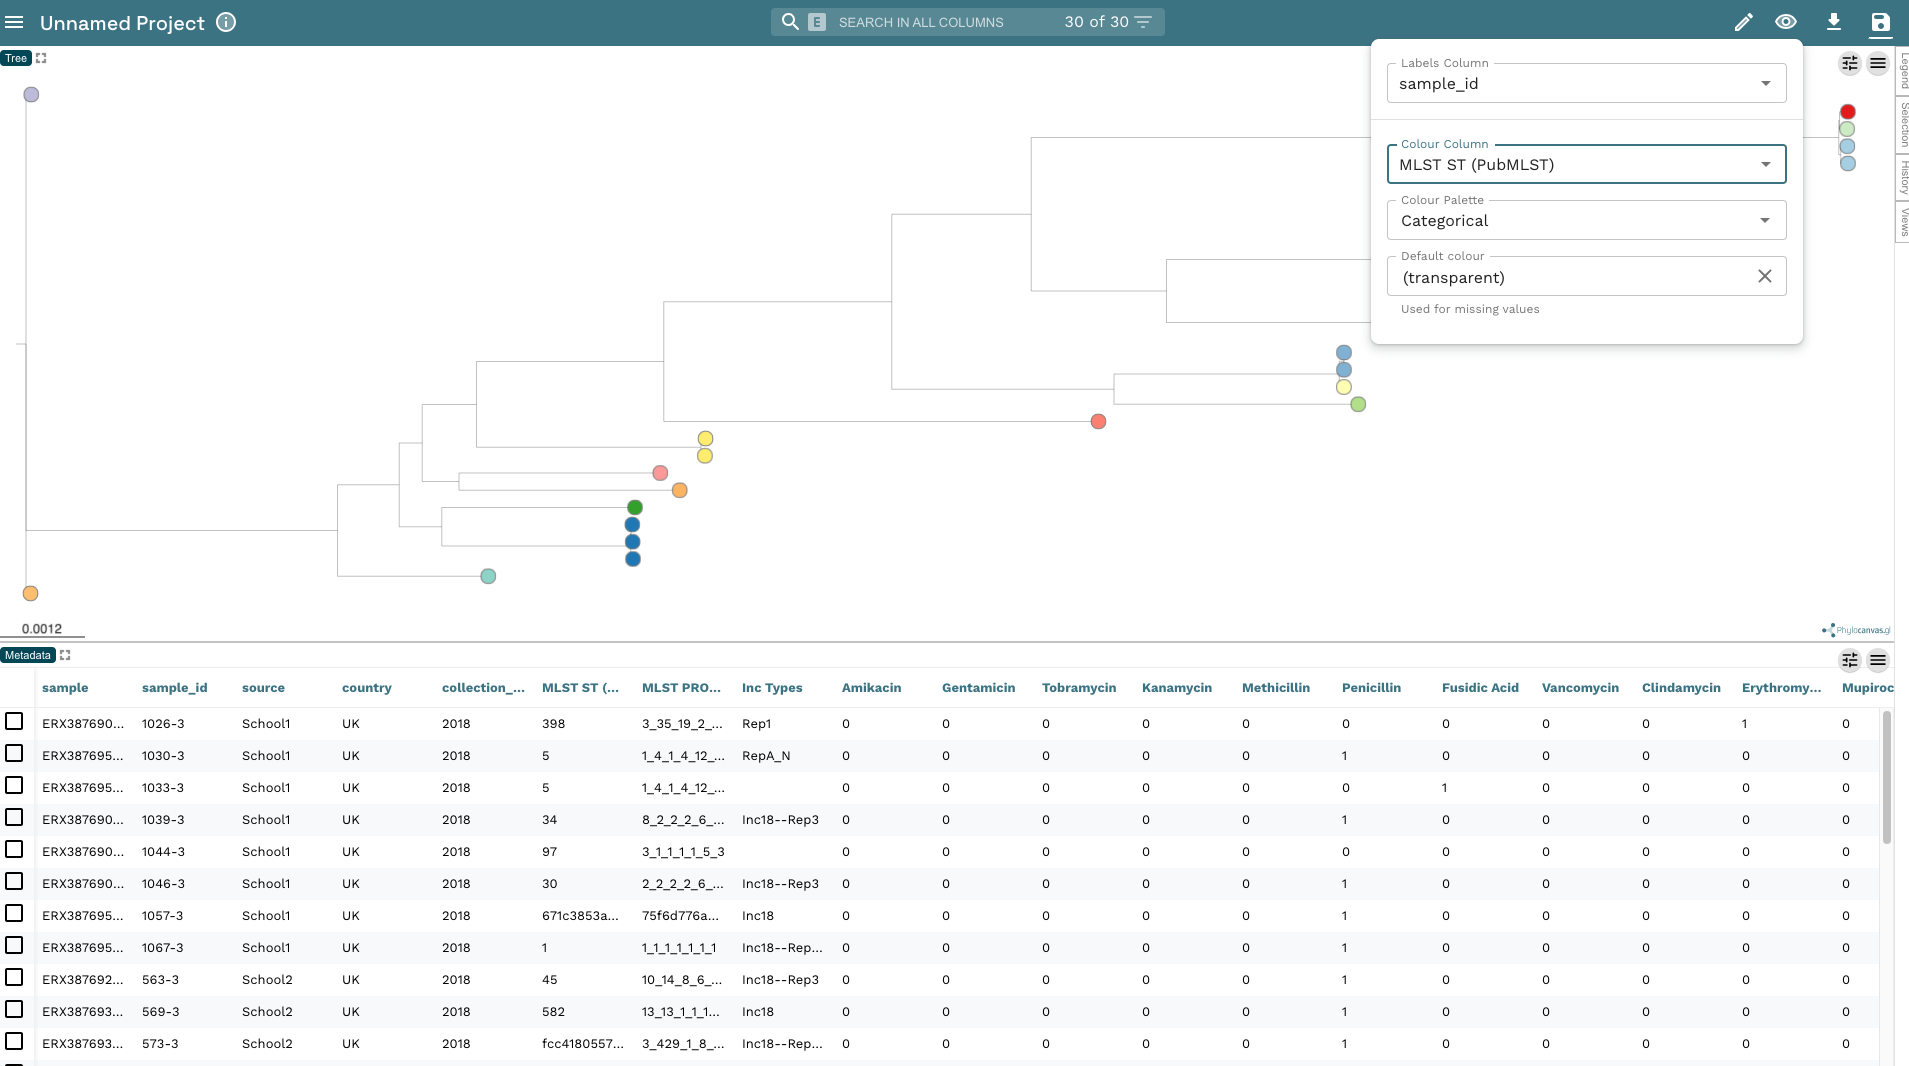
- Now change the Labels Column to
sample_idand the Colour Column toMLST ST (PubMLST):
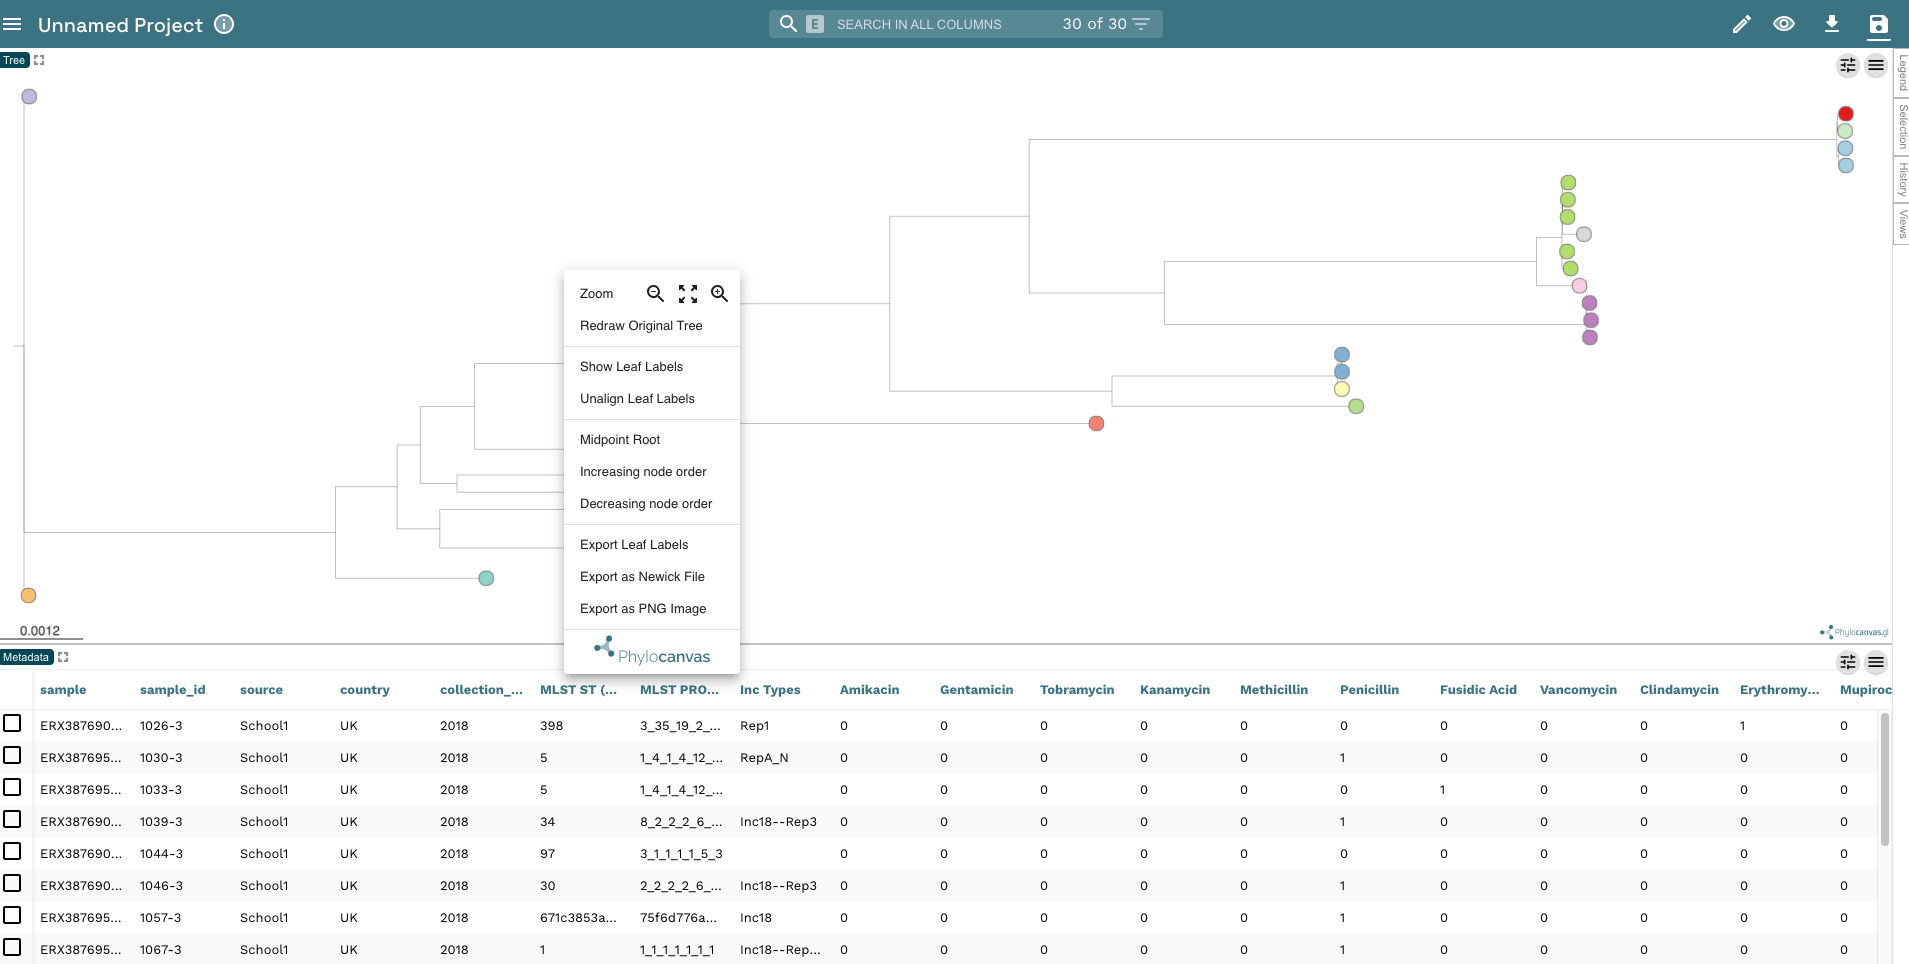
- In the previous tree, we used the TB ancestral reference sequence as an outgroup to root the tree. As we haven’t included an outgroup in our S. aureus dataset, we’ll midpoint root the tree (the root is positioned at the midpoint between the two longest branches). Right click on the tree plot and click Midpoint Root:
- Edit the tree so the tip labels are shown (you may need to adjust the size of the text) and reduce the size of the leaf nodes:
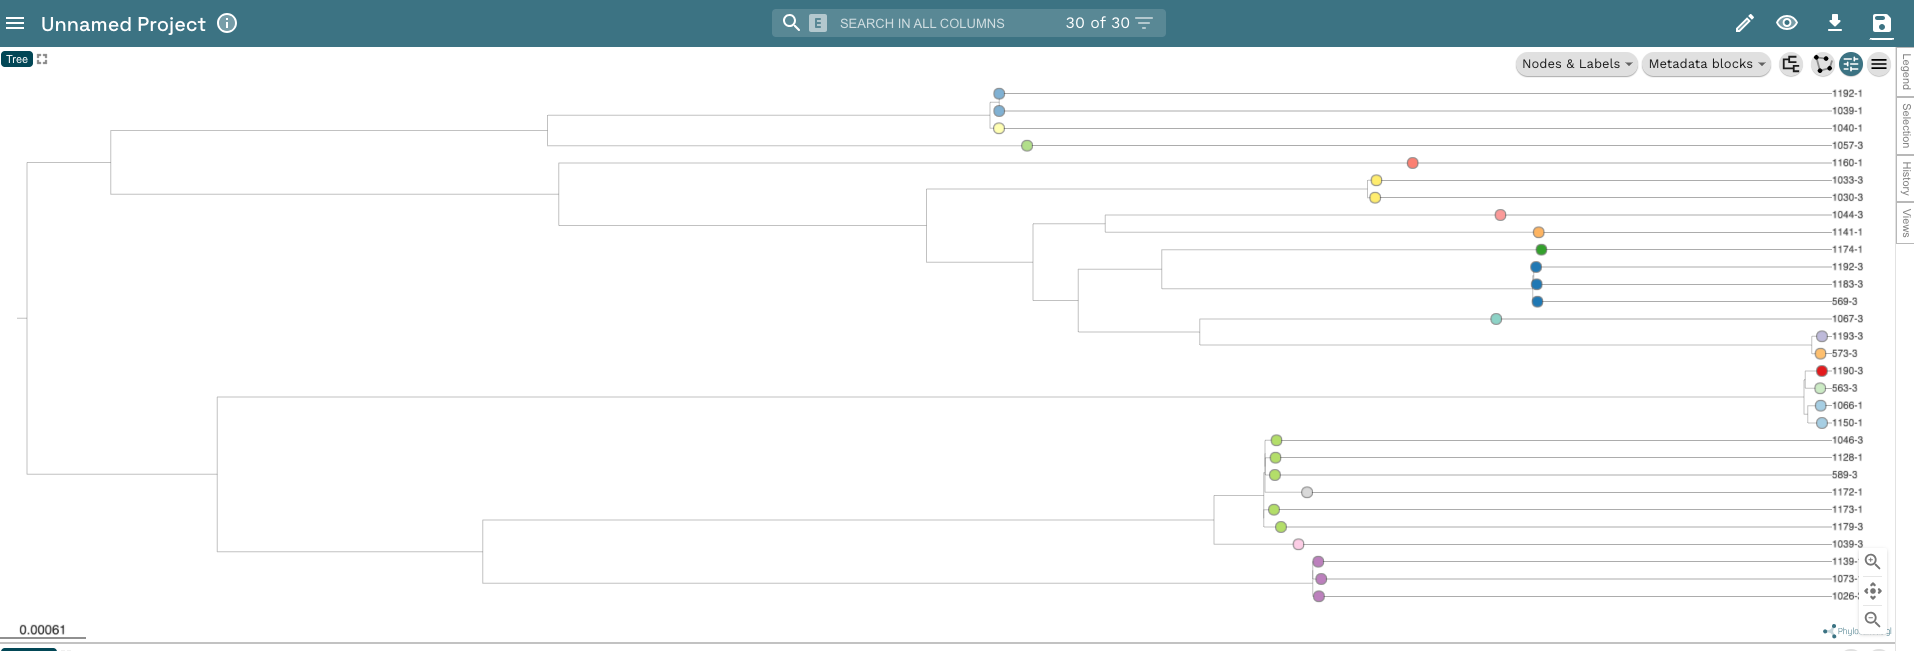
- We used
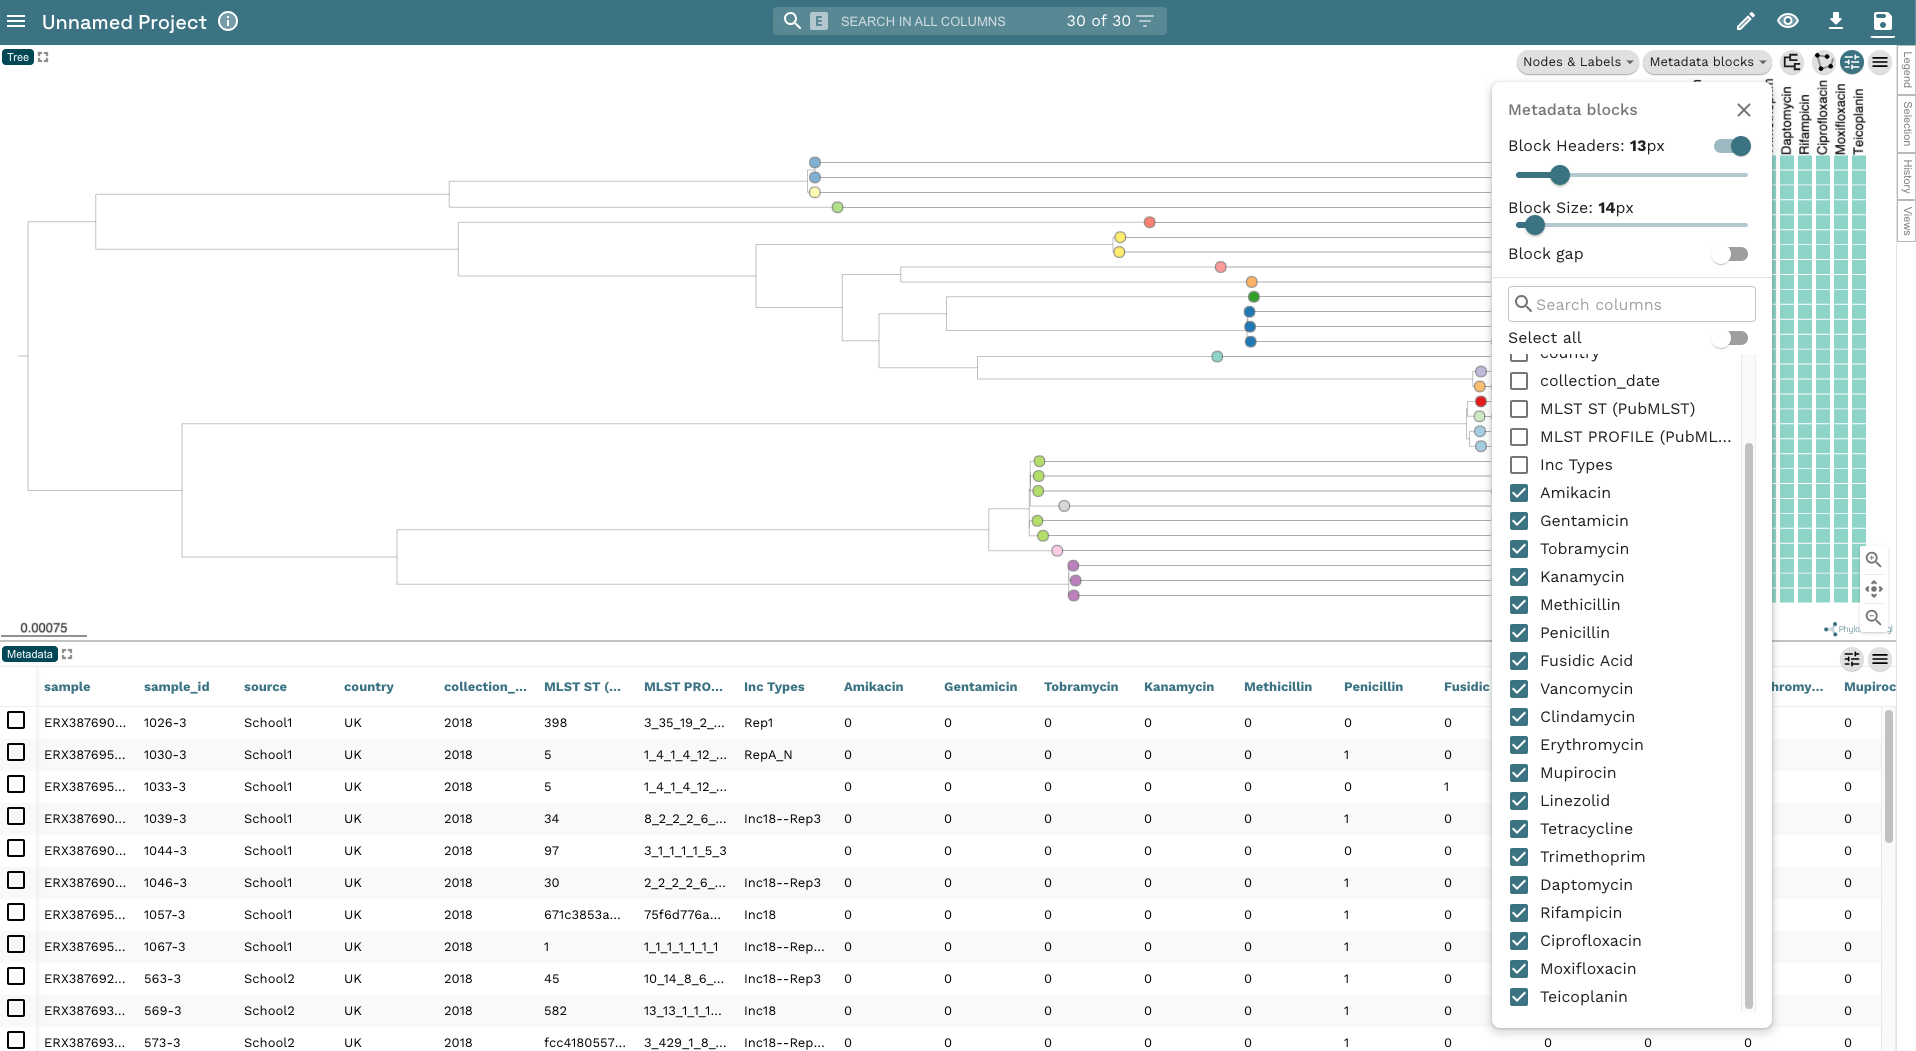
Pathogenwatchto predict the AMR profile of our isolates. Let’s go ahead and add that information as metadata blocks. Click on the Metadata blocks button in the top-right corner and select all of the drugs in the list:
- Save your project calling it something helpful like “School Staph”.
ExerciseExercise 1 - Add Legend and bar plot to the window
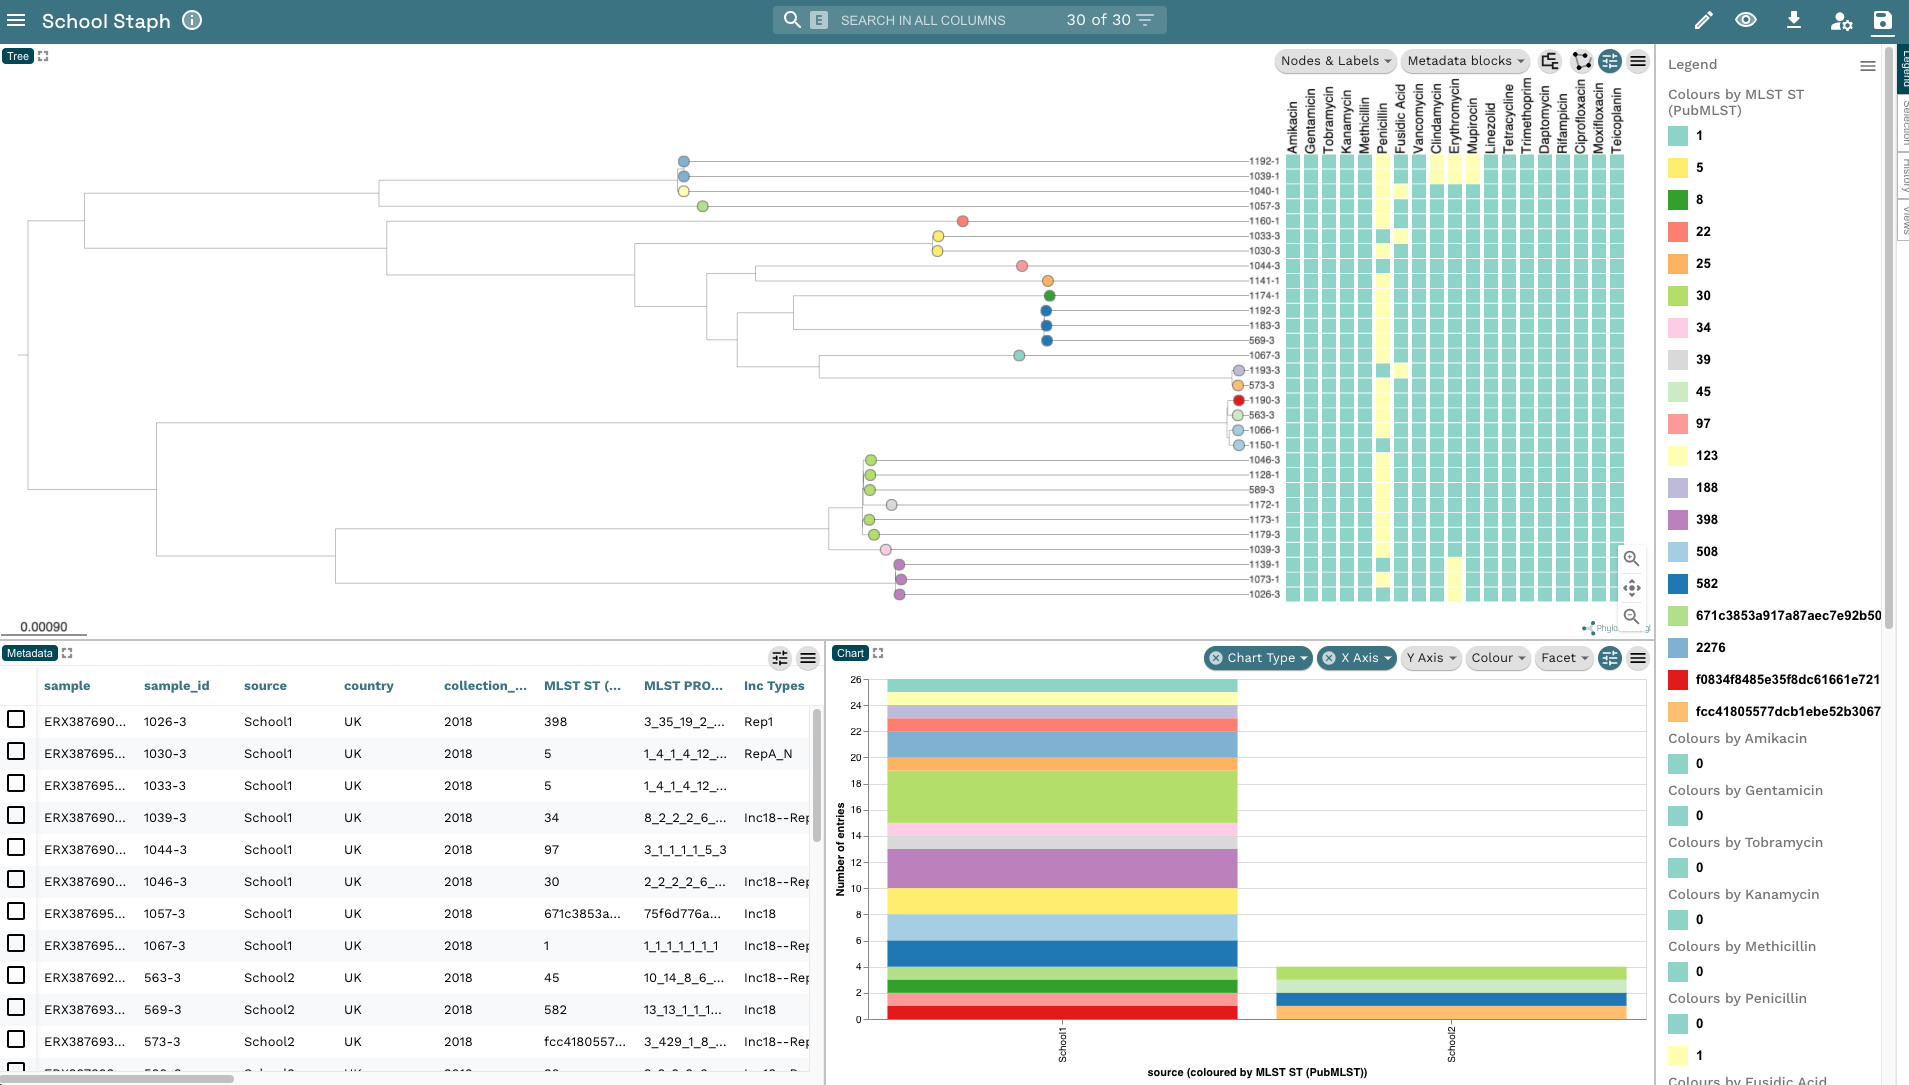
- Add a legend to the window so you can identify what each colour corresponds to.
- Add a bar chart to the window showing the distribution of STs in each school.
AnswerAnswer
- We clicked on the Legend button on the far right-hand side of the window to show the legend.
- We clicked, the Pencil icon, then Create New Chart and added a plot to the bottom left-hand side of the window. We then changed Chart Type to
Bar Chartand X Axis Column tosourceto create the chart:
28.1 Summary
TipKey Points
- Microreact is a user-friendly and flexible tool for tree visualisation.
- Several analysis results can be plotted alongside our tree, providing a richer view of our data.