7 Analysing protein-ligand interactions
- Visualise protein-ligand complexes in ChimeraX.
- Identify hydrogen bonds and other intermolecular contacts.
- Explore ligand binding pockets using surface representations.
- Select residues interacting with a ligand using distance-based selections.
- Interpret the structural features that stabilise ligand binding.
7.1 Overview
Proteins often interact with small molecules. These molecules may be:
- natural metabolites
- signalling molecules
- cofactors
- drugs designed to target a protein
The region where a small molecule binds is called the binding pocket. Understanding this pocket is central to many areas of biology and medicine, including drug design.
In this section we will learn how to analyse protein-ligand interactions using ChimeraX.
As an example, we will continue working with the estrogen receptor structure (PDB: 1ERE). This structure contains the hormone estradiol, labelled EST in the PDB file.
The estrogen receptor is an important drug target. Many therapies for breast cancer act by blocking or modifying ligand binding in this pocket.
The same tools we use here also apply to:
- experimentally determined structures
- predicted protein models
- predicted ligand docking results
7.2 Preparing the structure
We begin by loading the structure and keeping a single chain for clarity.
close
open 1ERE
delete #1/B-F
Next we create a visual representation that highlights the ligand.
style protein ball
hide atoms
show cartoon
show :EST atoms
style :EST sphere
colour :EST & C grey
colour :EST & O magenta
cofr :EST
These commands:
- show the protein as a cartoon, emphasising secondary structure
- display the ligand as atoms
- colour the ligand atoms by element
- set the centre of rotation (
cofr) on the ligand for easier inspection
The result is a view of the receptor with the ligand clearly positioned in the binding pocket.
7.3 Hydrogen bonds
One of the most important stabilising interactions between proteins and ligands is the hydrogen bond. Hydrogen bonds often determine:
- ligand specificity
- binding affinity
- orientation of the ligand in the pocket
ChimeraX can detect hydrogen bonds automatically using the hbonds command.
hbonds :EST reveal true log truereveal truedisplays hydrogen bonds as cyan dashed lines and reveals the corresponding atoms involved in the interactionlog truereports the interaction details in the log window
The output lists the atoms involved and the distances between them. Keep in mind that hydrogen bonds are inferred geometrically based on distance and angle criteria.
7.4 Other contacts
Hydrogen bonds are not the only interactions stabilising ligand binding. Ligands are often held in place by non-specific contacts, such as van der Waals interactions.
These interactions can be detected using the contacts command.
contacts :EST reveal true log trueThis command displays nearby atoms as green dashed lines, and reveals the corresponding atoms involved in the interaction.
Together, hydrogen bonds and other contacts provide a useful picture of how the ligand fits inside the binding pocket.
7.5 Surface representation
To better visualise the binding pocket, we can display the molecular surface of the ligand.
style :EST stick
show :EST surfaces
surface :EST color white transparency 65
Surface representations help illustrate:
- how tightly the ligand fits inside the pocket
- which parts of the ligand remain exposed to solvent
- the shape of the binding cavity
Surfaces are especially useful when examining drug binding sites.
7.6 Selecting residues near the ligand
Often we want to focus only on the residues that form the binding pocket. ChimeraX allows distance-based selections using the < operator.
The following command shows residues within 5 Å of the ligand:
hide protein cartoon
hide protein atoms
show :EST :<5
This reveals only the local environment surrounding the ligand.
Distance-based selections are useful for:
- identifying binding pocket residues
- analysing mutation effects
- preparing structures for docking or modelling studies
7.7 Exercises
In this exercise we will attempt to colour the protein atoms involved in the interactions between the ligand and the protein.
Start your session using the following code, which will show the ligand and the residues within 5 Å of the ligand, as well as the hydrogen bonds and contacts between the ligand and the protein.
close
open 1ERE
delete #1/B-F
style protein ball
style :EST stick
hide protein
hide solvent
colour :EST & C grey
colour :EST & O magenta
show :EST :<5
cofr :EST
hbonds :EST reveal true log true
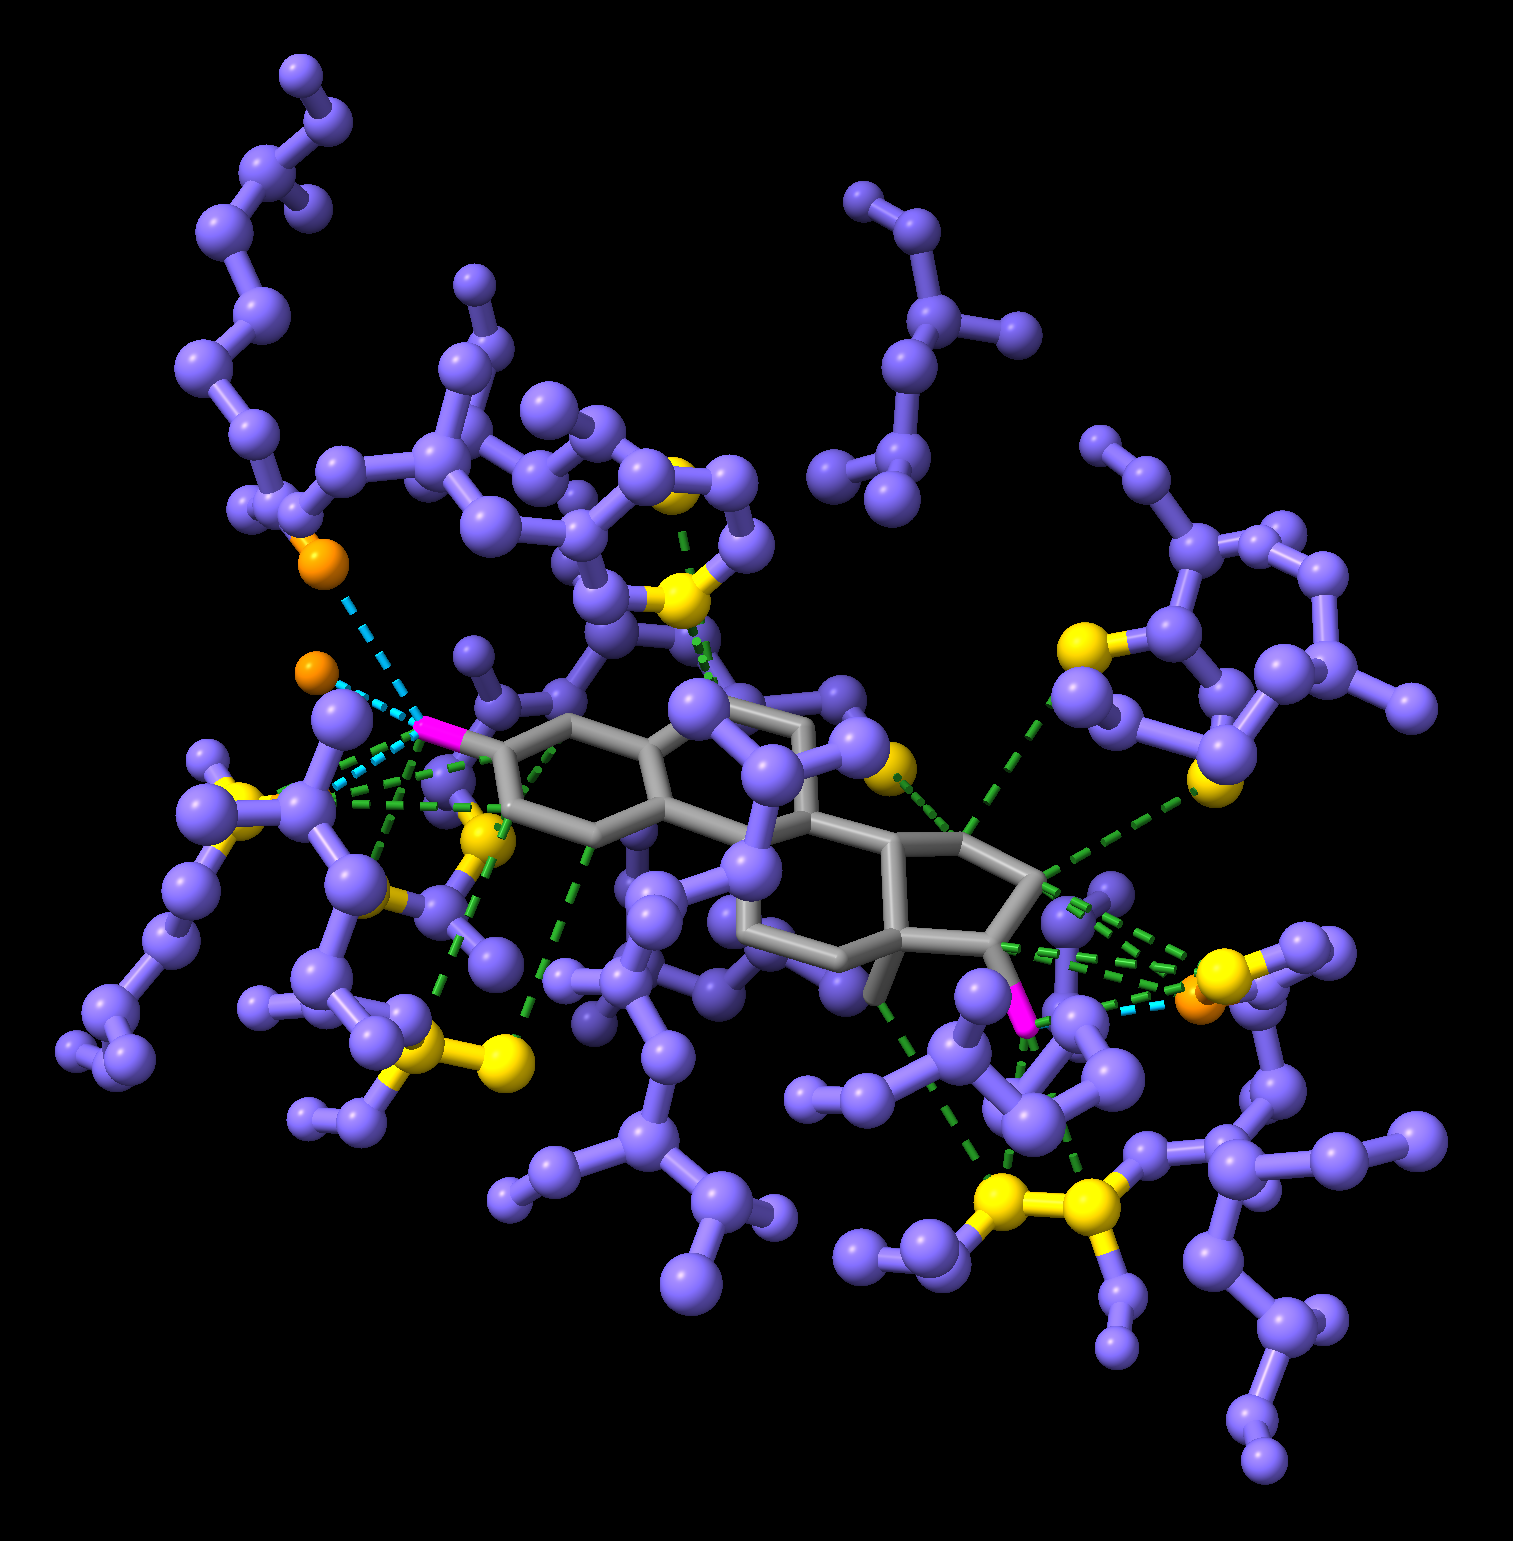
contacts :EST reveal true log trueUsing a combination of select and new keywords listed below, try to:
- Colour the protein atoms involved in hydrogen bonds in
darkorange - Colour the protein atoms involved in contacts in
gold
Here are some useful keywords to select atoms involved in interactions:
hbondsselects the pseudobonds (dashed lines) representing the hydrogen bondspbondsselects all pseudobonds (including both hydrogen bonds and contacts)hbondatomsselects the atoms as well as pseudobonds involved in the hydrogen bondspbondatomsselects the atoms as well as pseudobonds involved in the contacts