6 Predicting protein complexes
- Prepare inputs correctly for multimer predictions using ColabFold (AlphaFold2) and AlphaFold Server (AlphaFold3).
- Understand how AlphaFold models protein complexes.
- Interpret global and interface confidence metrics (pTM and ipTM).
- Use the PAE matrix to assess interactions between chains.
- Evaluate predicted interfaces critically.
- Understand how binding partners (e.g. DNA) can stabilise protein complexes.
6.1 Overview
Many proteins do not act alone. Instead they form complexes with:
- other proteins
- DNA or RNA
- small molecules or ligands
These interactions often determine the biological function of the protein. For example:
- enzymes may assemble into multimeric complexes
- transcription factors bind DNA
- receptors dimerise when activated
Predicting the structure of a single monomer can reveal the fold of a protein. However, to understand function we often need to predict how molecules interact.
AlphaFold can now model such complexes directly. This process is often called multimer prediction or co-folding.
6.2 How AlphaFold predicts complexes
When predicting a complex, AlphaFold receives multiple sequences as input. These may represent:
- several copies of the same protein (homomers)
- different proteins (heteromers)
- proteins together with nucleic acids or ligands (AlphaFold3 only)
The model then attempts to predict:
- the fold of each chain
- the relative positioning of the chains
- the interaction interface between them
This means AlphaFold must solve two related problems:
- Folding - predicting the structure of each individual chain
- Docking - predicting how the chains assemble together
The same confidence metrics used for monomers still apply (e.g. pLDDT and PAE), but multimer predictions also introduce additional interface-specific metrics.
6.3 Multimer confidence scores
When evaluating multimer predictions, it is important to distinguish between:
- confidence in the fold of each chain
- confidence in the interaction between chains
Several scores help us assess this.
6.3.1 pLDDT
As for monomers, pLDDT reports local confidence in the structure of each residue. High pLDDT values indicate that the model is confident in the local geometry of the fold.
However, high pLDDT does not guarantee that the interface is correct.
6.3.2 PAE
The Predicted Aligned Error (PAE) matrix becomes particularly useful in multimer predictions. The matrix can be divided into blocks:
- diagonal blocks describe confidence within each chain
- off-diagonal blocks describe confidence between chains
Low PAE values between chains suggest that the relative positioning of the chains is well defined. High cross-PAE indicates that the model is uncertain about the interface.
6.3.3 pTM and ipTM
Multimer predictions also report global confidence metrics:
pTM (predicted TM-score) - estimates the accuracy of the overall fold of the complex
ipTM (interface predicted TM-score) - estimates the accuracy of the interface between chains
Typical interpretations are:
| Score | Interpretation |
|---|---|
| pTM > 0.5 | overall fold likely correct |
| ipTM > 0.7 | interface likely reliable |
| ipTM < 0.5 | interface uncertain |
These scores should always be interpreted together with the PAE matrix and structural inspection.
6.4 Structure prediction in practice
To perform a multimer prediction using the AlphaFold Server web interface:
- Submit the sequences of all chains involved in the complex.
- Specify the copy number for each chain if the complex contains multiple identical subunits.
- If nucleic acids are present, include them as additional sequences.
For example:
- A homodimer requires the setting 2 copies for the protein in the input.
- A heterodimer requires adding two separate protein entities
- A protein-DNA complex requires adding the protein sequence(s) as well as the DNA sequence.
- When adding DNA, create a DNA entity and then click the
⋮button to add a reverse complement copy
- When adding DNA, create a DNA entity and then click the
AlphaFold3 automatically performs co-folding of all components.
After the prediction completes, the results include:
- predicted structure files
- global scores (pTM and ipTM)
- per-residue confidence (pLDDT)
- PAE matrices
These outputs can be explored directly on the server or downloaded for visualisation in ChimeraX.
ColabFold also supports multimer prediction using AlphaFold2.
The same parameters discussed in the monomer section apply here, but an additional parameter becomes important when modelling complexes.
Parameter: pair_mode
This parameter controls how ColabFold pairs sequences across multiple chains.
AlphaFold relies heavily on multiple sequence alignments (MSAs). For complexes, these alignments may contain information about coevolving residues between interacting proteins.
The pair_mode parameter determines how this information is used.
unpaired: Each chain receives its own independent MSA. Fast, but ignores possible correlations between interacting chains.paired: Sequences are paired by species, allowing the model to detect coevolution between residues of different chains. This can improve interface prediction but often results in sparse alignments.unpaired_paired: Combines both strategies.- full MSAs for learning the fold of each chain
- paired sequences when available to infer interactions.
This is usually the recommended option, as it balances folding accuracy with interface prediction.
6.5 Evaluating predicted interfaces
Evaluating whether the predicted interface is biologically plausible can be done with several checks:
Inspect the PAE matrix - low cross-PAE suggests confident interfaces
Examine ipTM scores - higher scores indicate more reliable interfaces
Visualise contacts between chains - interface residues should form realistic interactions
Consider biological context - does the predicted interface match what is known about the protein?
Importantly, AlphaFold sometimes produces interfaces that are geometrically plausible but biologically irrelevant. Confidence scores and biological knowledge should therefore always be used together.
6.6 Exercises
Reminder: In this exercise series you are investigating the structure of the amphioxus estrogen receptor and comparing it with experimentally determined human ER structures.
In previous exercises we predicted individual domains of the estrogen receptor and examined their structures separately. However, in the cell the receptor functions as a multi-component complex.
After binding ligand, two ER proteins form a homodimer. This dimer then binds specific DNA sequences called estrogen response elements (EREs) through the DNA-binding domains (DBDs).
Importantly, the relative orientation of the two DBDs is stabilised by the DNA itself. Without DNA, the two domains may not adopt a well-defined position relative to each other.
In this exercise we explore how including DNA in a prediction can change the confidence of the structural model.
We will compare two predictions:
- a dimer of the full ER protein
- the same dimer co-folded with DNA
This illustrates how co-folding with binding partners can resolve otherwise ambiguous interactions.
Tasks:
Submit two copies of the full amphioxus ER sequence (link to sequence) to the AlphaFold Server (AlphaFold3) to predict the receptor dimer.
Examine the PAE matrix, focusing on the interactions between the two DNA-binding domains.
What does the cross-PAE suggest about the relative positioning of the two DBDs?
Next, submit the same two ER sequences together with an estrogen response element (ERE) DNA sequence. Use the following sequence:
CCAGGTCACAGTGACCTGHint: AlphaFold3 expects double-stranded DNA. You therefore need to include both this strand and its reverse complement as two DNA chains.
Again examine the PAE matrix, focusing on the interactions between the two DBDs.
Compare the two predictions:
- How does the confidence of the DBD–DBD interface change when DNA is included?
- What does this tell you about the role of DNA in stabilising the receptor complex?
Load the co-folded complex in ChimeraX to inspect the predicted structure.
close cd ~/Course_Materials/er_amphioxus/full_homodimer_dna_complex_af3/ open fold_er_amphioxus_full_homodimer_dna_complex_af3_model_0.cif color bychain cartoon hide nucleic nucleotides atoms style nucleic sphere- What do you observe about the positioning of the two DNA-binding domains relative to the DNA?
- It may help to import UniProt annotations (ID: B3V8B7) and colour the DBDs to identify them more easily.
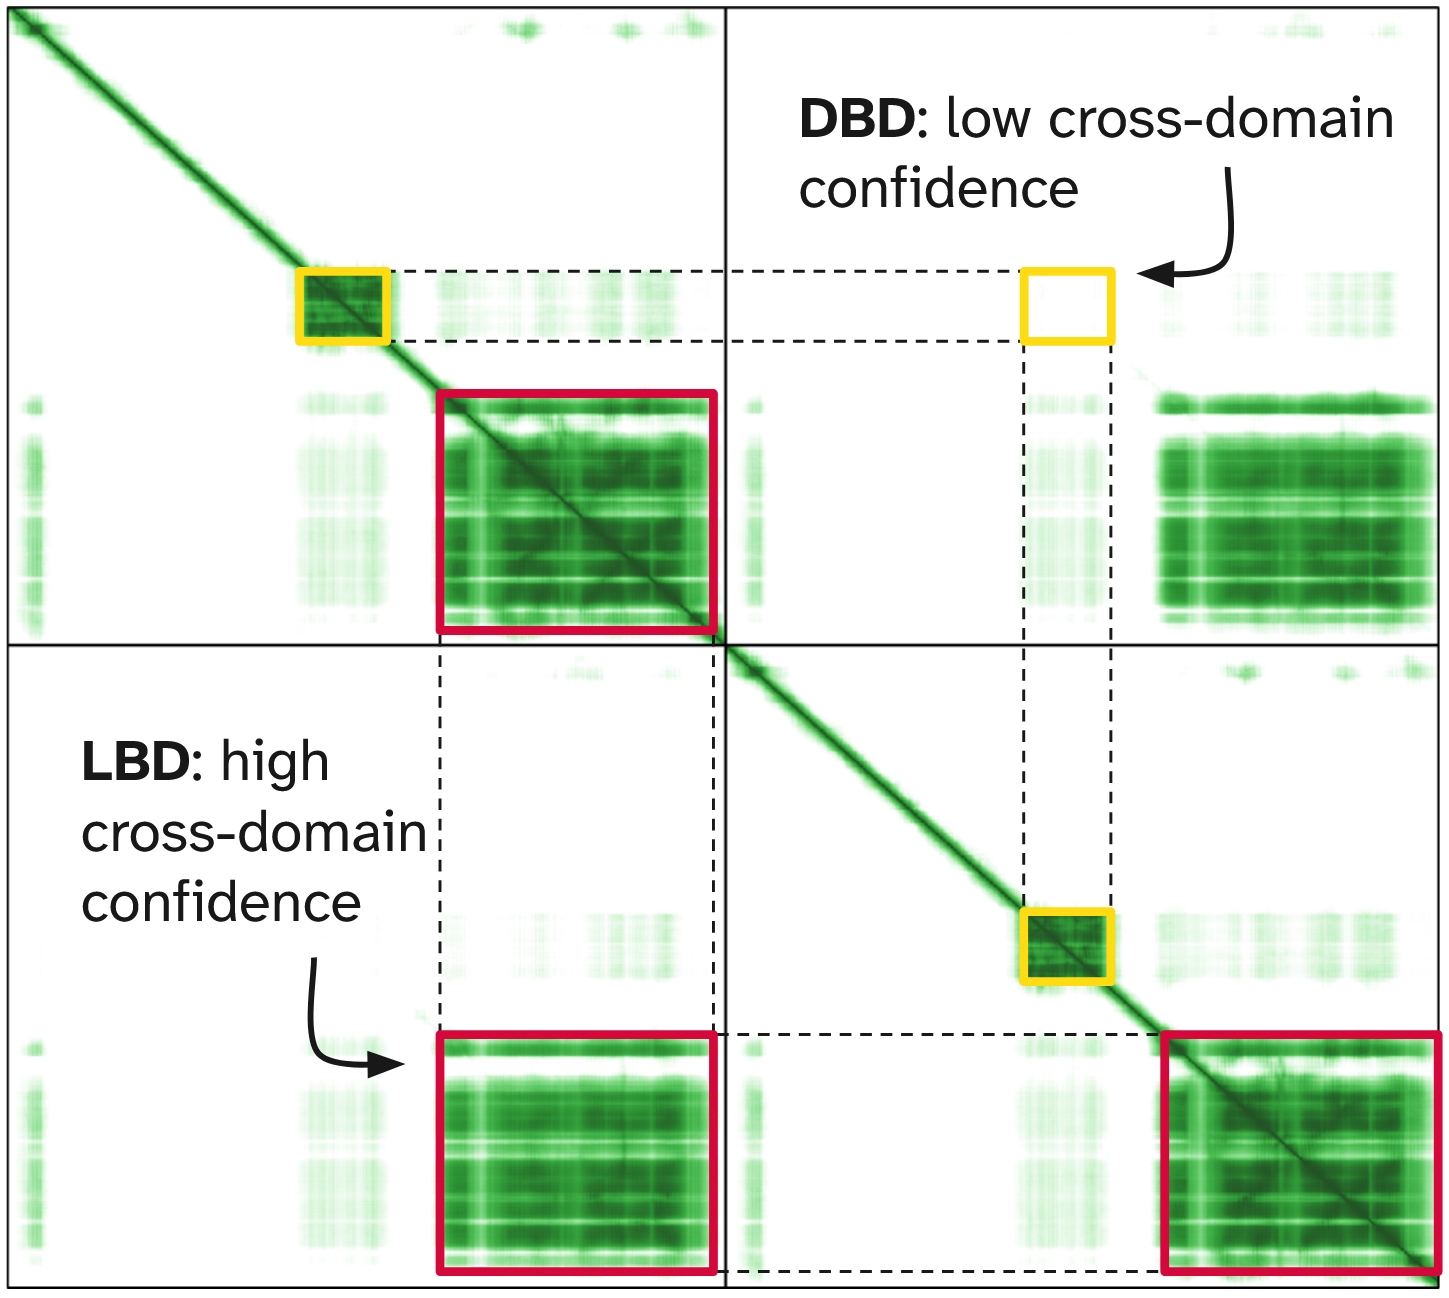
When predicting the ER homodimer without DNA, the model shows:
- good confidence for the ligand-binding domain dimer
- high cross-PAE between the two DNA-binding domains
This indicates that the model is uncertain about the relative positioning of the two DBDs.
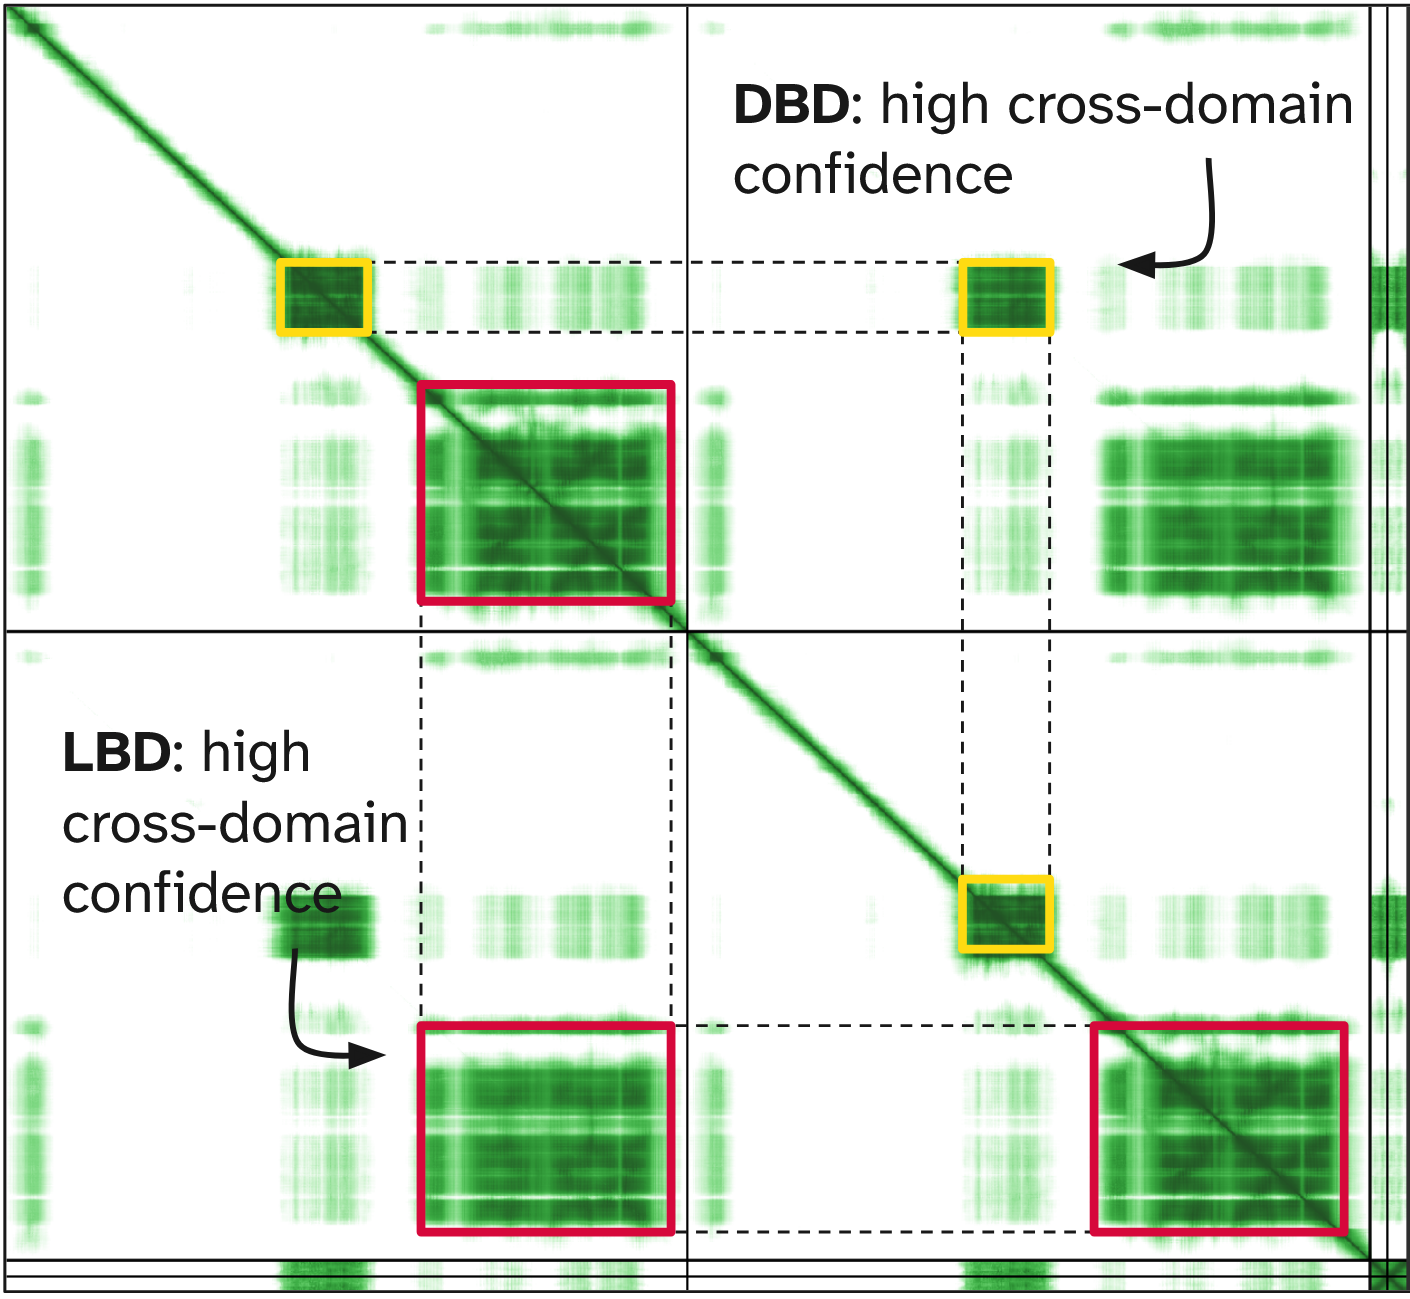
When the DNA sequence is included, the prediction changes:
- the two DBDs bind opposite halves of the DNA response element
- the cross-PAE between the DBDs becomes low
- the model is now confident about their relative orientation.
This shows that the DBDs do not form a stable interface on their own.
Instead, their positioning is stabilised when both domains bind the DNA sequence.We import UniProt annotations (ID: B3V8B7):
open B3V8B7 from uniprot format uniprot- From the annotation panel, we select “domain” → “Nuclear receptor”, which highlights residues 294-370. Based on this, we assign distinct colours to the different parts of each chain for easier visualisation:
color /A steelblue
color /B royalblue
color /A:294-370 gold
color /B:294-370 coral
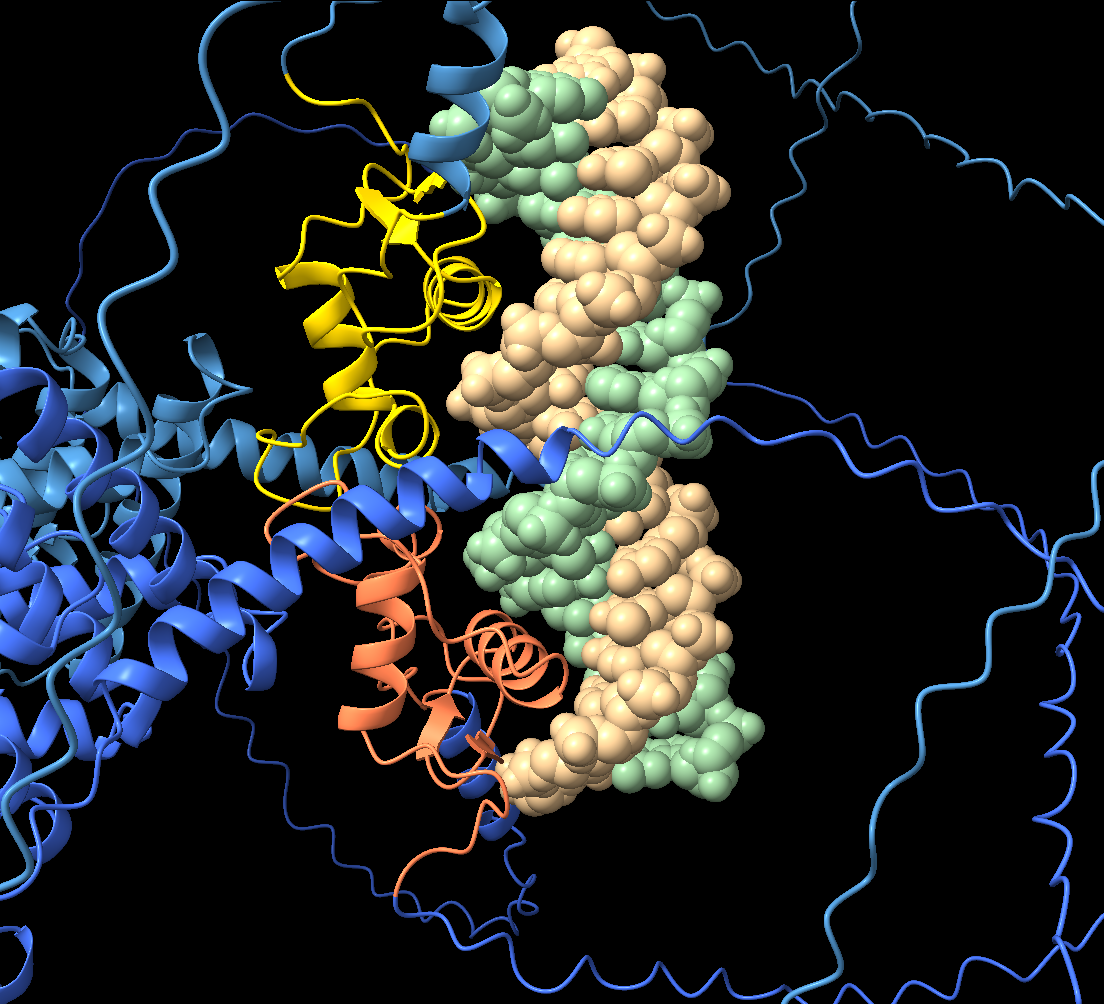
From this analysis, we can see that:
- the two DBDs insert recognition helices into the major groove of the DNA
- each domain binds one half of the response element
- the two domains make a small interface while bound to DNA.
This behaviour reflects the biological mechanism of nuclear receptors:
the ligand-binding domains drive dimerisation, while the DNA-binding domains are positioned by the DNA response element itself.
The high PAE between the DBDs in the absence of DNA is not a modelling failure - it reflects a real biological property. The domains only adopt a stable relative orientation when DNA is present, and including the DNA sequence in the prediction provides the constraint needed to resolve the complex.
Open the AlphaFold3 prediction of the full complex:
close
cd ~/Course_Materials/er_amphioxus/full_homodimer_dna_complex_af3/
open fold_er_amphioxus_full_homodimer_dna_complex_af3_model_0.cif
color bychain
cartoon hide nucleic
nucleotides atoms
style nucleic sphere
You will now compare the structure prediction of the LBD and DBD domains with the known human structures, to assess how good the prediction of the full complex was. To make this comparison easier, we split our full complex model into sub-models for each domain:
split #1 atoms #1/A-B:441-682 atoms #1/A-B:294-370 atoms #1/C-D
colour byidentity
cartoon hide #1.4
Looking at the output of info models you will see that we now have three sub-models:
#1.1is the ligand-binding domain, annotated as residues 441-682 on UniProt#1.2is the DNA-binding domain, annotated as residues 294-370 on UniProt#1.3is the DNA chains#1.4is rest of the structure (disorganised regions)
Tasks:
Use the commands below to import the human ligand-binding dimer (PDB: 1ERE, chains A and B), and then align it with model
#1.1(the LBD domain).open 1ERE delete #2/C-F hide #2 atoms cartoon #2 colour #2 goldUse the commands below to import the human DNA-binding dimer (PDB: 1HCQ), and then align it with model
#1.2(the DBD domain).open 1HCQ delete #3/C-H hide #3 atoms cartoon #3 colour #3 gold
What is your conclusion about the ability of AlphaFold3 to predict the full complex structure?
We align each of the human structures to our models:
mm #2 to #1.1
mm #3 to #1.2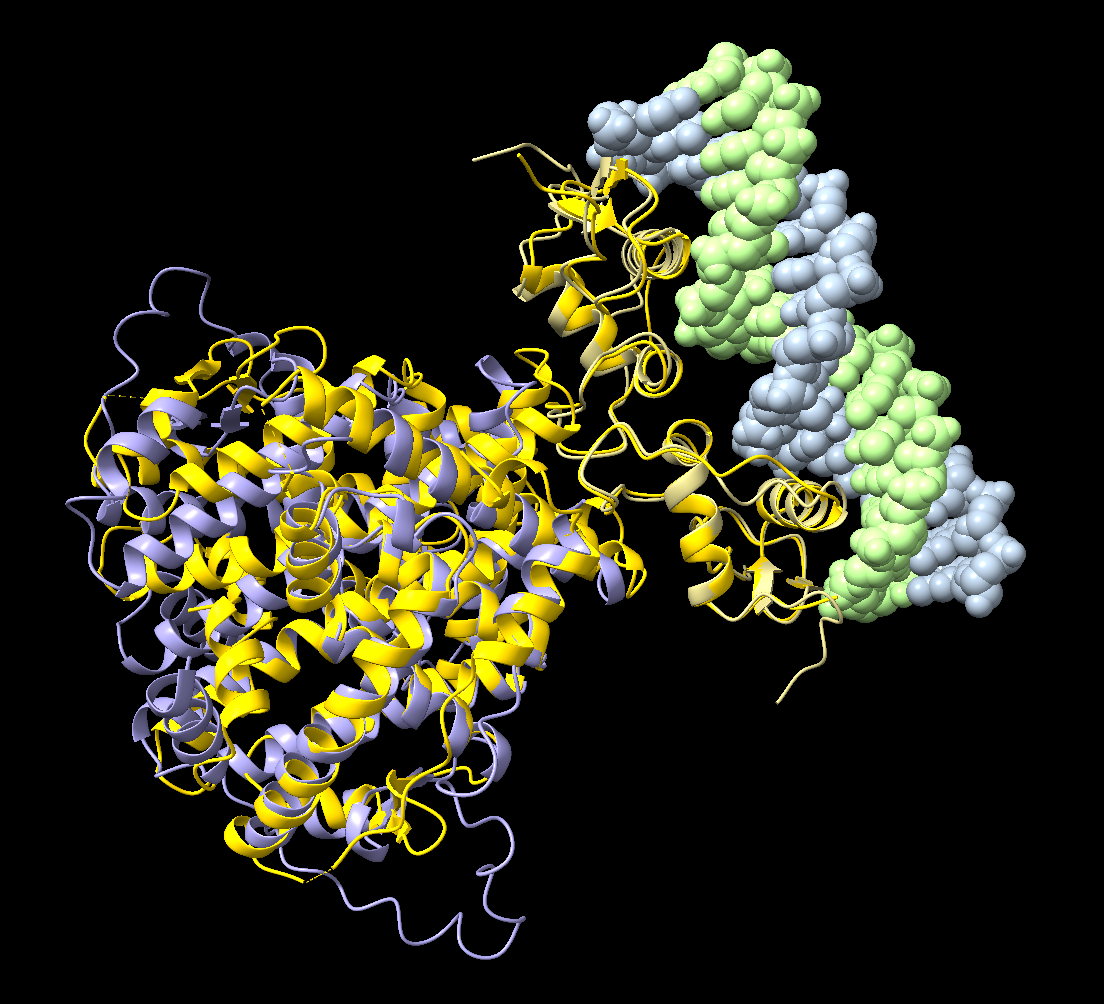
Overall we can see a strong agreement between the predicted amphioxus domains and the experimentally determined human structures, indicating that AlphaFold3 successfully captured the geometry of both the ligand-binding and DNA-binding domains within the full receptor complex.
Several observations can be made from this comparison:
The ligand-binding domain (LBD) of the amphioxus receptor aligns very closely with the human LBD dimer. This shows that the core helical architecture of the domain and its dimerisation interface are strongly conserved across evolution, despite substantial sequence divergence between these species (only ~30% sequence identity in this domain).
The DNA-binding domains (DBDs) also align well with the human ER structure bound to DNA. In particular, the recognition helices of each DBD are positioned in the DNA major groove in a manner very similar to the experimental structure.
Earlier in the exercises we saw that predicting the ER dimer without DNA resulted in high cross-PAE between the DBDs, indicating uncertainty about their relative positioning. When DNA was included in the prediction, the DBDs adopted a well-defined orientation with low cross-PAE. This reflects the biological mechanism of nuclear receptors, where DNA binding helps stabilise the arrangement of the two DBDs.
Taken together, these results show that AlphaFold3 is able to reconstruct the overall architecture of a multi-component complex by combining several sources of information: the intrinsic fold of each domain, the dimerisation interface of the LBD, and the structural constraints imposed by DNA binding.
This final comparison also illustrates a broader principle in structural bioinformatics: structural features that are critical for function are often conserved across large evolutionary distances, even when the underlying amino acid sequences differ substantially.
6.7 Summary
Many proteins function as oligomers rather than as single monomers.
Structure prediction methods can model protein-protein or protein-nucleic acid complexes.
Considering the biological assembly is often essential for understanding protein function.