4 Monomer structure prediction
- Predict protein structures using ColabFold (AlphaFold2) and AlphaFold Server (AlphaFold3).
- Choose appropriate prediction parameters for different biological questions.
- Interpret prediction outputs, including confidence scores and ranking metrics.
- Understand when monomer and multimer prediction are appropriate.
- Visualise and interpret predicted structures using ChimeraX.
4.1 Structure prediction
The AlphaFold Server provides a web interface for running structure predictions using AlphaFold3.
Compared with AlphaFold2, the newer model can predict more complex systems, including:
- protein monomers
- protein multimers
- protein-DNA complexes
- protein-ligand complexes
For a simple monomer prediction, the workflow is straightforward.
- Paste the protein sequence.
- Choose the number of copies (for monomer prediction this is 1).
- Submit the job and wait for the prediction to complete.
The server will return the predicted models along with confidence metrics.
ColabFold provides a convenient way to run AlphaFold2 predictions using Google Colab notebooks.
It uses a streamlined pipeline based on the original AlphaFold2 method but replaces the heavy sequence search step with the fast MMseqs2 search algorithm. This makes predictions much faster and easier to run on standard hardware.
ColabFold also provides several parameters that allow users to customise their predictions. These are detailed next.
Parameter: num_relax
Controls how many predicted models undergo energy minimisation using the AMBER force field. Relaxation improves local geometry but does not change the overall fold.
Typical settings:
0- no relaxation (fastest)1- relax only the top model (good compromise)5- relax all models (slowest)
Parameter: template_mode
Controls whether the model uses structural templates.
Options:
none- no templates (pure de novo prediction). Fastest and ideal when no homologous structure exists.pdb100- search PDB for structural templates. Improves accuracy if close homologues exist.custom- user-provided templates
Parameter: msa_mode
Controls how homologous sequences are collected.
Options:
single_sequence- only the input sequence (very fast; not recommended)mmseqs2_uniref- search UniRef database (balance of speed and depth)mmseqs2_uniref_env- include environmental sequences from metagenomic experiments (slower, but can improve accuracy)custom- user-supplied alignment
In most cases mmseqs2_uniref_env provides the best balance between speed and depth.
Parameter: model_type
Controls which AlphaFold model is used.
The auto setting usually works best because it selects the appropriate model based on the input (monomer or multimer).
Parameter: num_recycles
Controls how many times the model refines its prediction. During each cycle the predicted structure is fed back into the network, which has been shown to improve model accuracy.
Typical settings:
0- fastest, but not recommended3- good balance between speed and accuracy6+- higher accuracy for difficult foldsauto- run until convergence
Parameter: num_seeds
AlphaFold predictions include stochastic elements. Different random seeds can produce slightly different structures. Running multiple seeds increases the diversity of predictions.
Typical settings:
1- sufficient for most proteins2+- useful when exploring uncertain folds
Parameter: use_dropout
Dropout introduces additional stochasticity into the neural network. This can generate more diverse predictions, particularly in:
- flexible regions
- uncertain interfaces
- multimer predictions
It is often combined with multiple seeds to explore alternative conformations.
4.2 Download results
After a run completes, the results can be downloaded for further analysis. The most important outputs are:
Predicted structures
- Structure files in PDB or mmCIF format.
- Each file contains the predicted atomic coordinates.
Confidence scores
- pLDDT values stored per residue in the structure file.
- These values indicate the model’s confidence in each region.
PAE matrix
- A matrix describing the predicted positional error between residue pairs.
- Often visualised as a heatmap.
- These are stored in files with extension
.json.
Ranking information
- AlphaFold typically produces multiple models.
- These models are ranked according to global confidence metrics such as average pLDDT or pTM (ipTM for multimers).
- The ranking is included in the file name.
In practice, one usually examines the top-ranked model first, then compare it with alternative predictions.
4.3 Model scores
AlphaFold predictions include several confidence scores. These scores help us estimate how reliable a predicted structure is.
Broadly, these scores fall into two categories:
- Global scores - measure confidence in the overall fold of the protein.
- Local scores - measure confidence in specific regions of the structure.
Both are useful, but they answer different questions. The following table summarises these scores, with details in the following sections:
| Metric | What it measures | Range | Interpretation |
|---|---|---|---|
| pLDDT | Local per-residue confidence | 0-100 | High = accurate local geometry Low = uncertain or disordered region |
| PAE | Pairwise positional error | angstroms (A) | Low = confident domain relationships High = uncertain domain orientation |
| pTM | Global fold accuracy | 0-1 | >0.5 → overall fold likely correct <0.5 → unreliable model |
4.3.1 Global confidence scores
Global scores describe the reliability of the overall protein fold.
pTM
The predicted Template Modelling score (pTM) estimates how accurate the global structure is expected to be.
The score ranges from 0 to 1.
Typical interpretation:
| pTM | Interpretation |
|---|---|
| >0.7 | very reliable fold |
| 0.5-0.7 | likely correct overall fold |
| <0.5 | unreliable prediction |
This score is particularly useful when comparing multiple predicted models.
Average pLDDT
Although pLDDT is calculated per residue, some tools (such as ColabFold) also report the average pLDDT across the entire structure. This value provides a quick summary of model quality.
Typical interpretation:
| Avg pLDDT | Interpretation |
|---|---|
| >90 | very high confidence model |
| 70-90 | good model |
| 50-70 | uncertain structure |
| <50 | likely disordered or incorrect |
However, average values can hide local properties of the prediction. A model may have a high average pLDDT while still containing poorly predicted loops or flexible regions. Conversely, a model may have low average pLDDT while still containing confidently predicted domains.
4.3.2 Local confidence scores
Local scores describe confidence within specific regions of the structure. These scores help identify flexible loops, disordered regions, or uncertain domain orientations.
pLDDT
The predicted Local Distance Difference Test (pLDDT) measures confidence for each residue.
Scores range from 0 to 100.
Typical interpretation:
| pLDDT | Confidence |
|---|---|
| >90 | very high confidence |
| 70-90 | confident |
| 50-70 | low confidence |
| <50 | likely disordered |
AlphaFold stores pLDDT values in the B-factor column of the structure file (.pdb/.cif). ChimeraX can colour residues using this information, as we will see below.
PAE
The Predicted Aligned Error (PAE) describes the expected positional error between pairs of residues. It is usually shown as a matrix heatmap.
This score answers a different question:
How confident is the model about the relative positions of different parts of the protein?
Here, lower values are better, and typical patterns include:
- Dark diagonal blocks → well-defined secondary structures or structural domains
- Light off-diagonal regions → uncertain orientation between domains
High PAE between domains often indicates that the domains fold correctly but their relative orientation is flexible or uncertain.
AlphaFold learns to estimate its own prediction confidence during training.
During training:
- The model learns to predict protein structures from sequence data.
- Additional components of the network learn to estimate the reliability of those predictions.
The pLDDT, PAE, and pTM scores therefore reflect the model’s internal estimate of accuracy, based on patterns it learned from many experimentally solved protein structures.
4.4 ChimeraX
The three-dimensional structures predicted by AlphaFold can be loaded into ChimeraX, along with their confidence scores.
First, it is convenient to change the ChimeraX workding directory to where the data is located on the computer. On our training computers, this is:
cd ~/Course_MaterialsAlphaFold Server outputs the structure as a .cif file, with the following naming convention:
- The prefix
fold_ - The name used by the user upon job submission
- The model ranking -
model_[0-5]- for the five models generated, in order of global confidence score (i.e. model 0 is the highest-confidence model)
We use the open command to load the structure into ChimeraX:
open p53_human/p53_monomer_af3/fold_p53_monomer_af3_model_0.cifColabFold outputs the structure as a .pdb file, with the following naming convention:
The name used by the user upon job submission, followed by a job submission string
An indicator of whether the model is unrelaxed or relaxed (if using
num_relaxoption)The model ranking -
rank_[001-X]- for the X models generated, in order of global confidence score (i.e.rank_001is the highest-confidence model)The model number -
_alphafold2_ptm_model_[1-5]- corresponding to the five AlphaFold2 neural network modelsThe random seed number -
seed_[000-X]
We use the open command to load the structure into ChimeraX:
open p53_human/p53_monomer_af2/p53_monomer_af2_7c637_unrelaxed_rank_001_alphafold2_ptm_model_1_seed_000.pdbOnce loaded, the structure appears in the main viewer.
4.4.1 Colouring by confidence score
AlphaFold stores pLDDT values in the B-factor column of the structure file. The B-factor field normally stores atomic temperature factors in experimental structures. AlphaFold repurposes this field to store confidence values.
To colour residues by confidence:
colour bfactor palette alphafold key true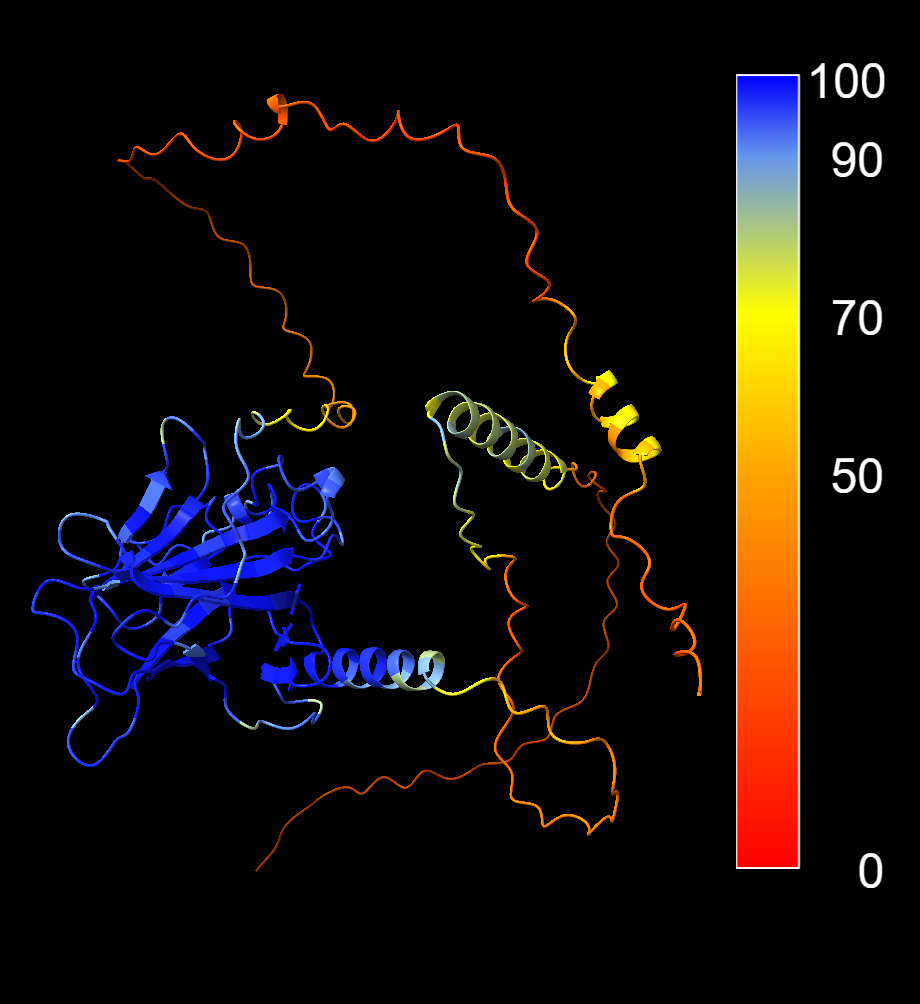
This applies the standard AlphaFold colour scheme:
- Blue - very high confidence
- Cyan - confident
- Yellow - low confidence
- Orange/red - very low confidence
Regions coloured yellow or red often correspond to:
- flexible loops
- disordered regions
- poorly constrained predictions
The key true option opens a menu to set a legend, but can be left out if you prefer.
4.4.2 Viewing the PAE matrix
The Predicted Aligned Error (PAE) describes the expected positional error between pairs of residues. Lower values indicate higher confidence in the relative positions of those residues.
The PAE matrix is stored in a text-based format called .json, following a naming convention matching the corresponding structure file.
To load the PAE matrix in ChimeraX:
alphafold pae #1 palette paegreen file p53_human/p53_monomer_af3/fold_p53_monomer_af3_full_data_0.jsonalphafold pae #1 palette paegreen file p53_human/p53_monomer_af2/p53_monomer_af2_7c637_scores_rank_001_alphafold2_ptm_model_1_seed_000.jsonChimeraX will display the matrix as a heatmap. You can interactively select blocks on the heatmap, which will get highlighted in the structure.
You can also ask ChimeraX to automatically identify potential structural domains based on the PAE matrix. Either by clicking the “Color PAE Domains” in the PAE menu, or by running the following command:
alphafold pae #1 colorDomains trueThis command analyses the PAE matrix and groups residues into coherent domains - regions where the model predicts low relative positional error. ChimeraX then colours each domain with a different colour in the structure.
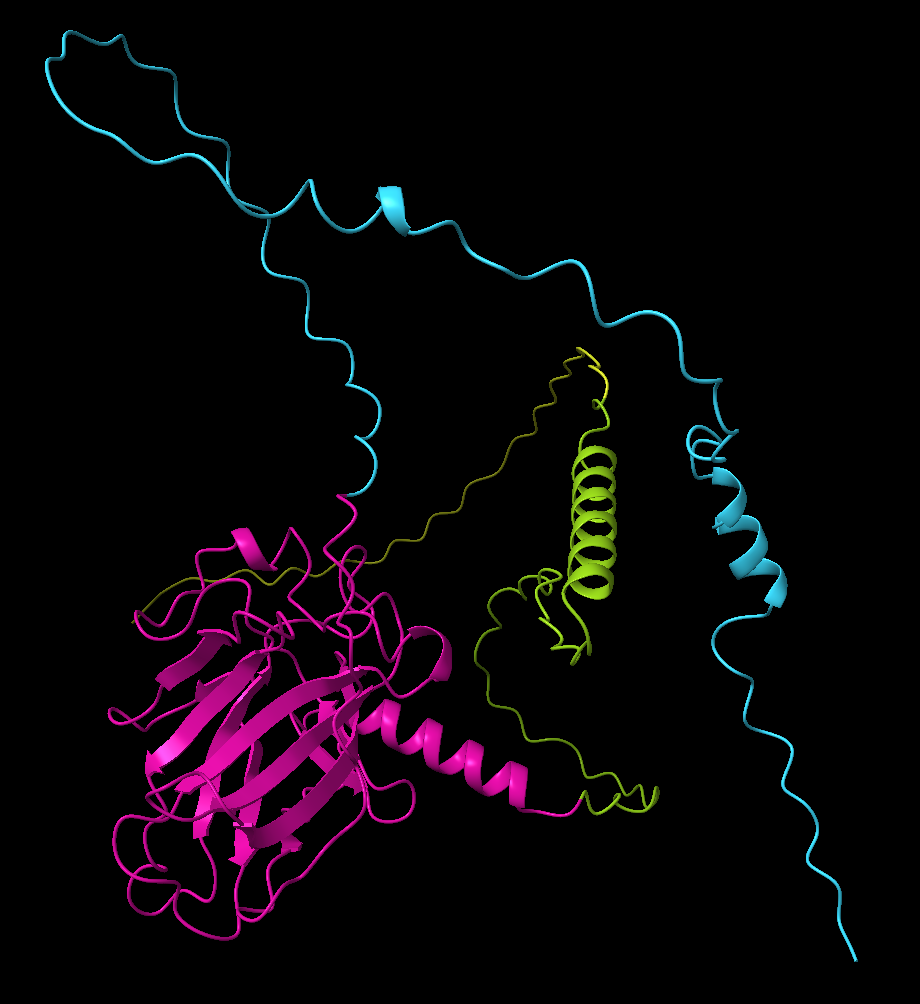
This can be very useful when analysing large proteins, especially when domain boundaries are not known in advance. In many cases the automatically identified domains correspond closely to independently folded structural units.
ChimeraX also stores the domain assignments as an attribute (pae_domain). You can use this attribute to select or recolour individual domains later if needed.
4.5 Exercises
You are studying the evolution of the estrogen receptor (ER), a nuclear hormone receptor that regulates gene expression in response to estrogen binding. This is a well-studied protein, with important roles in the development of sexual characteristics and in diseases such as breast cancer.
In humans, two genes encode estrogen receptors: ESR1 and ESR2. These proteins contain several well-characterised domains, including a DNA-binding domain (DBD) that recognises specific DNA sequences known as estrogen response elements (EREs), and a ligand-binding domain (LBD) that binds estrogen and other ligands.
ER proteins function as dimers and regulate transcription by binding DNA and recruiting transcriptional machinery.

The structure of the human ERα ligand-binding domain has been resolved experimentally (for example PDB 1ERE). In this exercise series, you will compare this experimentally determined structure with predicted structures from an evolutionarily distant species.
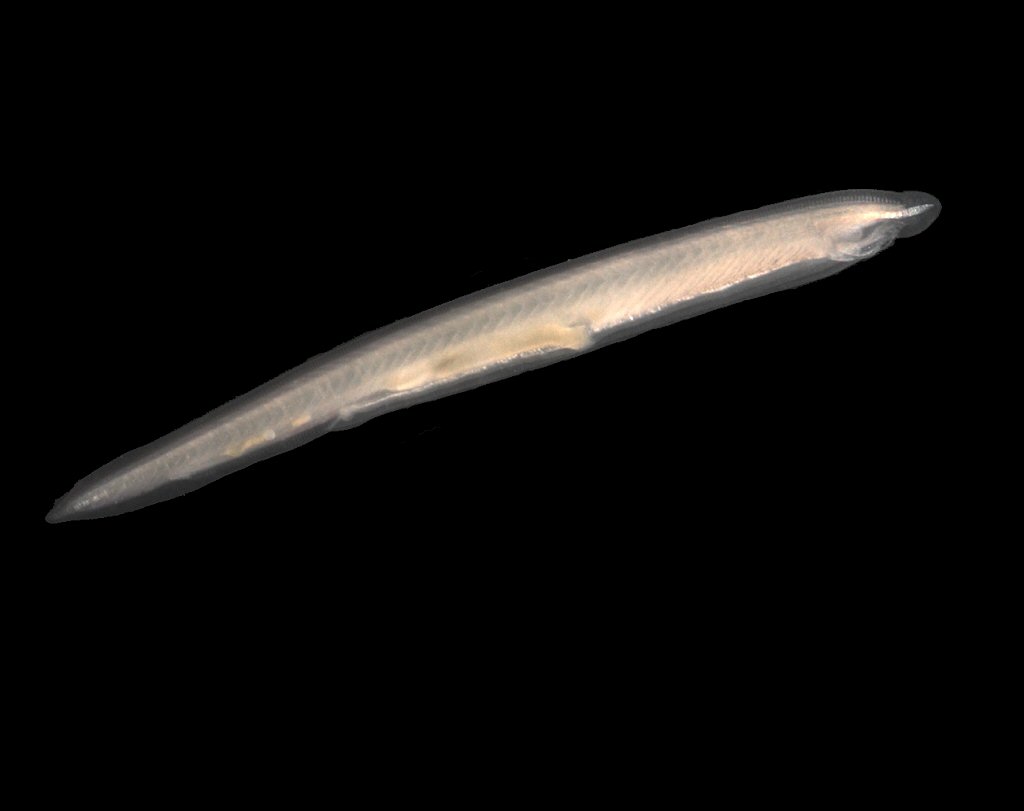
Based on Baker et al. (2015), the most basal lineage known to contain estrogen receptor proteins is the cephalochordate amphioxus (genus Branchiostoma), an invertebrate chordate that diverged before vertebrates. Studying the ER from amphioxus provides an opportunity to explore how conserved the structure of this protein is across deep evolutionary time. For example, the ligand binding domain is only around 35% identical at the sequence level compared to human.
4.6 Summary
- Predicted models must be evaluated critically, even when produced by advanced methods.
- Structure prediction tools such as AlphaFold provide confidence metrics that should always be examined when interpreting predicted models.
- Global scores (such as pTM) reflect confidence in the overall structure, while local scores (pLDDT) reflect confidence in specific regions.
- Large proteins with flexible or intrinsically disordered regions often have lower global confidence scores.
- AlphaFold confidence scores (pLDDT) help identify regions of a protein that are likely to be well structured versus flexible or disordered.
- The Predicted Aligned Error (PAE) matrix indicates how confidently AlphaFold predicts the relative positioning of different regions of a protein.
- Multidomain proteins often contain well-predicted domains connected by flexible regions with lower confidence.
- Example: In the ER case study, the DNA-binding and ligand-binding domains appear as high-confidence regions, while other parts of the protein show low confidence consistent with flexible regions.
- Predicting individual domains can sometimes yield more reliable models than predicting the entire protein.
Foundational AlphaFold papers
Jumper et al. (2021) Highly accurate protein structure prediction with AlphaFold. https://doi.org/10.1038/s41586-021-03819-2
Abramson et al. (2024) Accurate structure prediction of biomolecular interactions with AlphaFold3. https://doi.org/10.1038/s41586-024-07487-w
Accessible explainers
Illustrated AlphaFold https://elanapearl.github.io/blog/2024/the-illustrated-alphafold/
AlphaFold2 is here: what’s behind the structure prediction miracle? https://www.blopig.com/blog/2021/07/alphafold-2-is-here-whats-behind-the-structure-prediction-miracle/