13 AMR analysis
- Recognise the threats posed by antimicrobial resistance (AMR) to public health globally.
- Apply both command line and web applications to find potential AMR genes in a set of genomes.
- Recognise the limitations of computational AMR prediction and the importance of comparing results across multiple tools.
13.1 Antimicrobial Resistance (AMR) analysis
Antimicrobial resistance (AMR) is a phenomenon where microorganisms, such as bacteria, evolve in a way that reduces the effectiveness of antimicrobial drugs, including antibiotics. This occurs due to the overuse and misuse of these drugs, which exerts selective pressure on the microorganisms. As a result, bacteria may develop or acquire genetic changes that enable them to survive exposure to antimicrobial agents, making the drugs less effective or entirely ineffective. AMR poses a significant global health threat, as it can lead to infections that are challenging to treat, potentially causing increased morbidity and mortality. Efforts to combat AMR include responsible antibiotic use, developing new drugs, and enhancing infection prevention and control measures.

According to the WHO, antimicrobial resistance (AMR) has evolved into a global concern for public health. This stems from various harmful bacterial strains developing resistance to antimicrobial medications, including antibiotics. As part of our analysis, we will now focus on identifying AMR patterns connected to our V. cholerae isolates.
Numerous software tools have been created to predict the presence of genes linked to AMR in genome sequences. Estimating the function of a gene or protein solely from its sequence is complex, leading to varying outcomes across different software tools. It is advisable to employ multiple tools and compare their findings, thus increasing our confidence in identifying which antimicrobial drugs might be more effective for treating patients infected with the strains we’re studying.
In this section we will introduce a workflow aimed at combining the results from various AMR tools into a unified analysis. We will compare its results with AMR analysis performed by Pathogenwatch.
Nextflow is a program designed for building and running complex workflows (also known as pipelines). It simplifies the process of orchestrating complex computational pipelines that involve various tasks, inputs and outputs, and parallel processing. Nextflow is particularly well-suited for bioinformatics, where workflows often involve many steps, tools, and data transformations. It’s designed to work across different environments, including local machines, clusters, and cloud platforms.
There are many publicly-available Nextflow pipelines available, which users can take advantage of. In particular, nf-core is an community-driven, open-source project aimed at providing high-quality bioinformatics pipelines for a wide range of applications. The project’s goal is to offer standardized and well-documented workflows, allowing researchers to more easily set up and run complex analyses while following best practices and ensuring reproducibility.
By using nf-core pipelines, researchers can save time and effort that would otherwise be spent developing and fine-tuning their own analysis workflows.
13.2 Funcscan workflow
Here, we introduce an automated workflow called nf-core/funcscan (Figure 13.2), which uses Nextflow to manage all the software and analysis steps (see information box above). This pipeline uses five different AMR screening tools: ABRicate, AMRFinderPlus (NCBI Antimicrobial Resistance Gene Finder), fARGene (Fragmented Antibiotic Resistance Gene idENntifiEr), RGI (Resistance Gene Identifier), and DeepARG. This is convenient, as we can obtain the results from multiple approaches in one step.
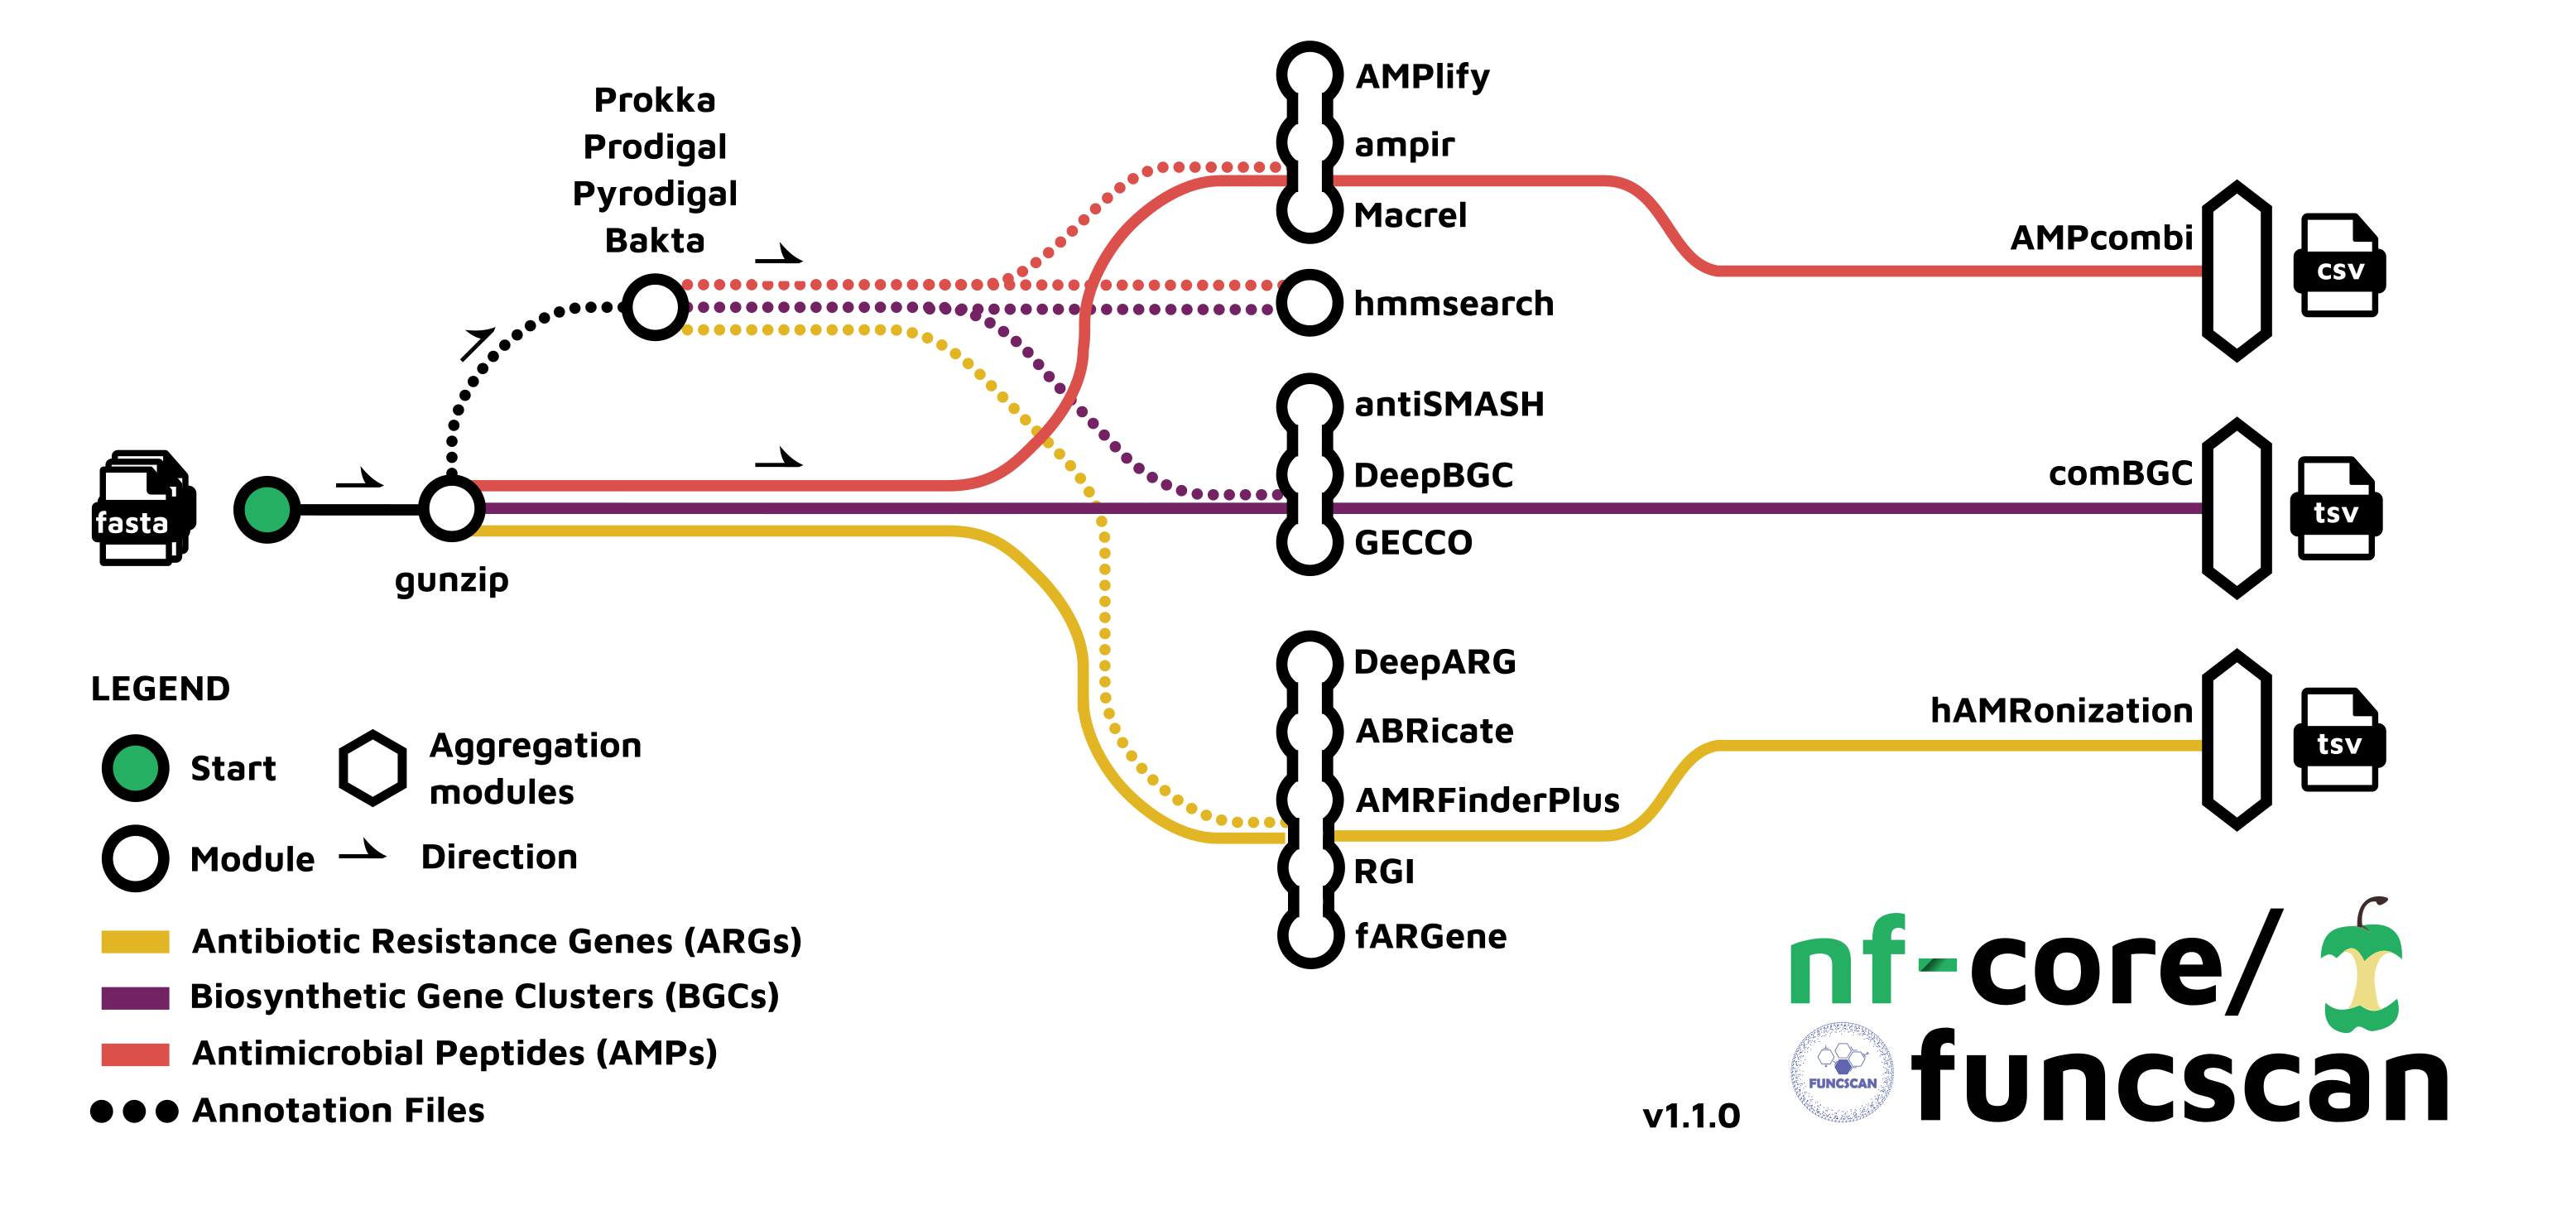
nf-core/funcscan workflow. In our case we will run the “Antimicrobial Resistance Genes (ARGs)” analysis, shown in yellow. Image source: https://nf-co.re/funcscan/1.1.2This pipeline requires us to prepare a samplesheet CSV file with information about the samples we want to analyse. Two columns are required:
sample–> a sample name of our choice (we will use the same name that we used for the assembly).fasta–> the path to the FASTA file corresponding to that sample.
You can create this file using a spreadsheet software such as Excel, making sure to save the file as a CSV. Here is an example of our samplesheet, which we saved in a file called samplesheet_funcscan.csv:
sample,fasta
isolate01,results/assemblies/isolate01.fasta
isolate02,results/assemblies/isolate02.fasta
isolate03,results/assemblies/isolate03.fasta
isolate04,results/assemblies/isolate04.fasta
isolate05,results/assemblies/isolate05.fasta
isolate06,results/assemblies/isolate06.fasta
isolate07,results/assemblies/isolate07.fasta
isolate08,results/assemblies/isolate08.fasta
isolate09,results/assemblies/isolate09.fasta
isolate10,results/assemblies/isolate10.fasta
Once we have the samplesheet ready, we can run the nf-core/funcscan workflow using the following commands:
# activate the environment
mamba activate nextflow

# create output directory
mkdir results/funcscan

# run the pipeline
nextflow run nf-core/funcscan -profile singularity \
  --max_memory 16.GB --max_cpus 8 \
  --input samplesheet_funcscan.csv \
  --outdir results/funcscan \
  --run_arg_screening \
  --arg_skip_deeparg
The options we used are:
-profile singularity- indicates we want to use the Singularity program to manage all the software required by the pipeline (another option is to usedocker). See Data & Setup for details about their installation.--max_memoryand--max_cpus- sets the available RAM memory and CPUs. You can check this with the commandsfree -handnproc --all, respectively.--input- the samplesheet with the input files, as explained above.--outdir- the output directory for the results.--run_arg_screening- indicates we want to run the “antimicrobial resistance gene screening tools”. There are also options to run antimicrobial peptide and biosynthetic gene cluster screening (see documentation).--arg_skip_deeparg- this skips a step in the analysis which uses the software DeepARG. We did this simply because this software takes a very long time to run. But in a real analysis you may want to leave this option on.
While the pipeline runs, you will get a progress printed on the screen, and then a message once it finishes. Here is an example from our samples:
[4a/77ac77] process > NFCORE_FUNCSCAN:FUNCSCAN:INPUT_CHECK:SAMPLESHEET_CHECK (samplesheet_funcscan.csv) [100%] 1 of 1 ✔
[-        ] process > NFCORE_FUNCSCAN:FUNCSCAN:GUNZIP_FASTA_PREP                                        -
[97/6d505c] process > NFCORE_FUNCSCAN:FUNCSCAN:BIOAWK (isolate09)                                       [100%] 10 of 10 ✔
[4f/aa117b] process > NFCORE_FUNCSCAN:FUNCSCAN:ARG:AMRFINDERPLUS_UPDATE (update)                        [100%] 1 of 1 ✔
[9b/ba9bf2] process > NFCORE_FUNCSCAN:FUNCSCAN:ARG:AMRFINDERPLUS_RUN (isolate10)                        [100%] 10 of 10 ✔
[15/0eaa8c] process > NFCORE_FUNCSCAN:FUNCSCAN:ARG:HAMRONIZATION_AMRFINDERPLUS (isolate10)              [100%] 10 of 10 ✔
[d8/3ed91e] process > NFCORE_FUNCSCAN:FUNCSCAN:ARG:FARGENE (isolate10)                                  [100%] 100 of 100 ✔
[2f/ab7c5c] process > NFCORE_FUNCSCAN:FUNCSCAN:ARG:HAMRONIZATION_FARGENE (isolate10)                    [100%] 102 of 102 ✔
[4a/7116be] process > NFCORE_FUNCSCAN:FUNCSCAN:ARG:RGI_MAIN (isolate09)                                 [100%] 10 of 10 ✔
[34/82b92c] process > NFCORE_FUNCSCAN:FUNCSCAN:ARG:HAMRONIZATION_RGI (isolate09)                        [100%] 10 of 10 ✔
[5d/c349c5] process > NFCORE_FUNCSCAN:FUNCSCAN:ARG:ABRICATE_RUN (isolate09)                             [100%] 10 of 10 ✔
[93/162a59] process > NFCORE_FUNCSCAN:FUNCSCAN:ARG:HAMRONIZATION_ABRICATE (isolate09)                   [100%] 10 of 10 ✔
[79/725687] process > NFCORE_FUNCSCAN:FUNCSCAN:ARG:HAMRONIZATION_SUMMARIZE                              [100%] 1 of 1 ✔
[4a/1f36ad] process > NFCORE_FUNCSCAN:FUNCSCAN:CUSTOM_DUMPSOFTWAREVERSIONS (1)                          [100%] 1 of 1 ✔
[be/0d7355] process > NFCORE_FUNCSCAN:FUNCSCAN:MULTIQC                                                  [100%] 1 of 1 ✔
-[nf-core/funcscan] Pipeline completed successfully-
Completed at: 10-Aug-2023 11:52:22
Duration    : 34m 54s
CPU hours   : 3.0
Succeeded   : 277
13.2.1 funcscan outputs
The main output of interest from this pipeline is a CSV file, which contains a summary of the results from all the AMR tools used This summary is produced by a software called hAMRonization and the corresponding CSV file is saved in results/funcscan/reports/hamronization_summarize/hamronization_combined_report.tsv. You can open this file using any standard spreadsheet software such as Excel (Figure 13.3).
This file is quite large, containing many columns and rows (we detail these columns in the information box below). The easiest way to query this table is to filter the table based on the column “antimicrobial_agent” to remove rows where no AMR gene was detected (Figure 13.3). This way you are left with only the results which were positive for the AMR analysis.

TODO
You can also look at the detailed results of each individual tool, which can be found in the directory results/funcscan/arg. This directory contains sub-directories for each of the 5 AMR tools used (in our case only 4 folders, because we skipped the DeepARG step):
ls results/funcscan/argabricate amrfinderplus fargene hamronization rgiFor each individual tool’s output folder shown above, there is a report, which is associated with the predicted AMRs for each of our samples. In most cases, the report is in tab-delimited TSV format, which can be opened in a standard spreadsheet software such as Excel. For instance, the AMR report from Abricate for one of our samples looks like this:
less -S results/funcscan/arg/abricate/isolate02/isolate02.txt#FILE SEQUENCE START END STRAND GENE COVERAGE COVERAGE_MAP GAPS %COVERAGE %IDENTITY DATABASE ACCESSION PRODUCT RESISTANCE
isolate02.fasta contig_2 1696 2623 - blaPER-7 1-927/927 ========/====== 1/1 100.00 99.89 ncbi NG_049966.1 class A extended-spectrum beta-lactamase PER-7 CEPHALOSPORIN
isolate02.fasta contig_2 4895 5738 - sul1 1-840/840 ========/====== 4/4 100.00 98.93 ncbi NG_048091.1 sulfonamide-resistant dihydropteroate synthase Sul1 SULFONAMIDE
isolate02.fasta contig_2 6243 7036 - aadA2 1-792/792 ========/====== 2/2 100.00 99.50 ncbi NG_047343.1 ANT(3'')-Ia family aminoglycoside nucleotidyltransferase AadA2 STREPTOMYCIN
isolate02.fasta contig_3 966452 967081 + catB9 1-630/630 =============== 0/0 100.00 99.84 ncbi NG_047621.1 type B-5 chloramphenicol O-acetyltransferase CatB9 CHLORAMPHENICOL
isolate02.fasta contig_4 778899 780023 + varG 1-1125/1125 =============== 0/0 100.00 100.00 ncbi NG_057468.1 VarG family subclass B1-like metallo-beta-lactamase CARBAPENEM
isolate02.fasta contig_4 2573875 2574348 - dfrA1 1-474/474 =============== 0/0 100.00 100.00 ncbi NG_047676.1 trimethoprim-resistant dihydrofolate reductase DfrA1 TRIMETHOPRIM
isolate02.fasta contig_7 4178 5099 - mph(A) 1-921/921 ========/====== 1/1 100.00 99.35 ncbi NG_047986.1 Mph(A) family macrolide 2'-phosphotransferase MACROLIDE
isolate02.fasta contig_7 6594 8069 + msr(E) 1-1476/1476 =============== 0/0 100.00 100.00 ncbi NG_048007.1 ABC-F type ribosomal protection protein Msr(E) MACROLIDE
isolate02.fasta contig_7 8125 9009 + mph(E) 1-885/885 =============== 0/0 100.00 100.00 ncbi NG_064660.1 Mph(E) family macrolide 2'-phosphotransferase MACROLIDE
isolate02.fasta contig_7 131405 132197 + aadA2 1-792/792 ========/====== 1/1 100.00 99.62 ncbi NG_047343.1 ANT(3'')-Ia family aminoglycoside nucleotidyltransferase AadA2 STREPTOMYCINFor this sample there were several putative AMR genes detected by Abricate, with their associated drugs. These genes were identified based on their similarity with annotated sequences from the NCBI database. For example, the gene varG was detected in our sample, matching the NCBI accession NG_057468.1. This is annotated as as a reference for antimicrobial resistance, in this case to the drug “CARBAPENEM”.
Here is a trick using standard commands to count how many times each drug was identified by funcscan:
cat results/funcscan/reports/hamronization_summarize/hamronization_combined_report.tsv | cut -f 10 | sort | uniq -ccatprints the content of the filecutextracts the 10th column from the filesortanduniq -care used in combination to count unique output values
The result of the above command is:
 9 CARBAPENEM
 8 CEPHALOSPORIN
 8 CHLORAMPHENICOL
27 MACROLIDE
13 QUATERNARY AMMONIUM
10 STREPTOMYCIN
 1 SULFONAMIDE
10 TRIMETHOPRIM
13.3 AMR with Pathogenwatch
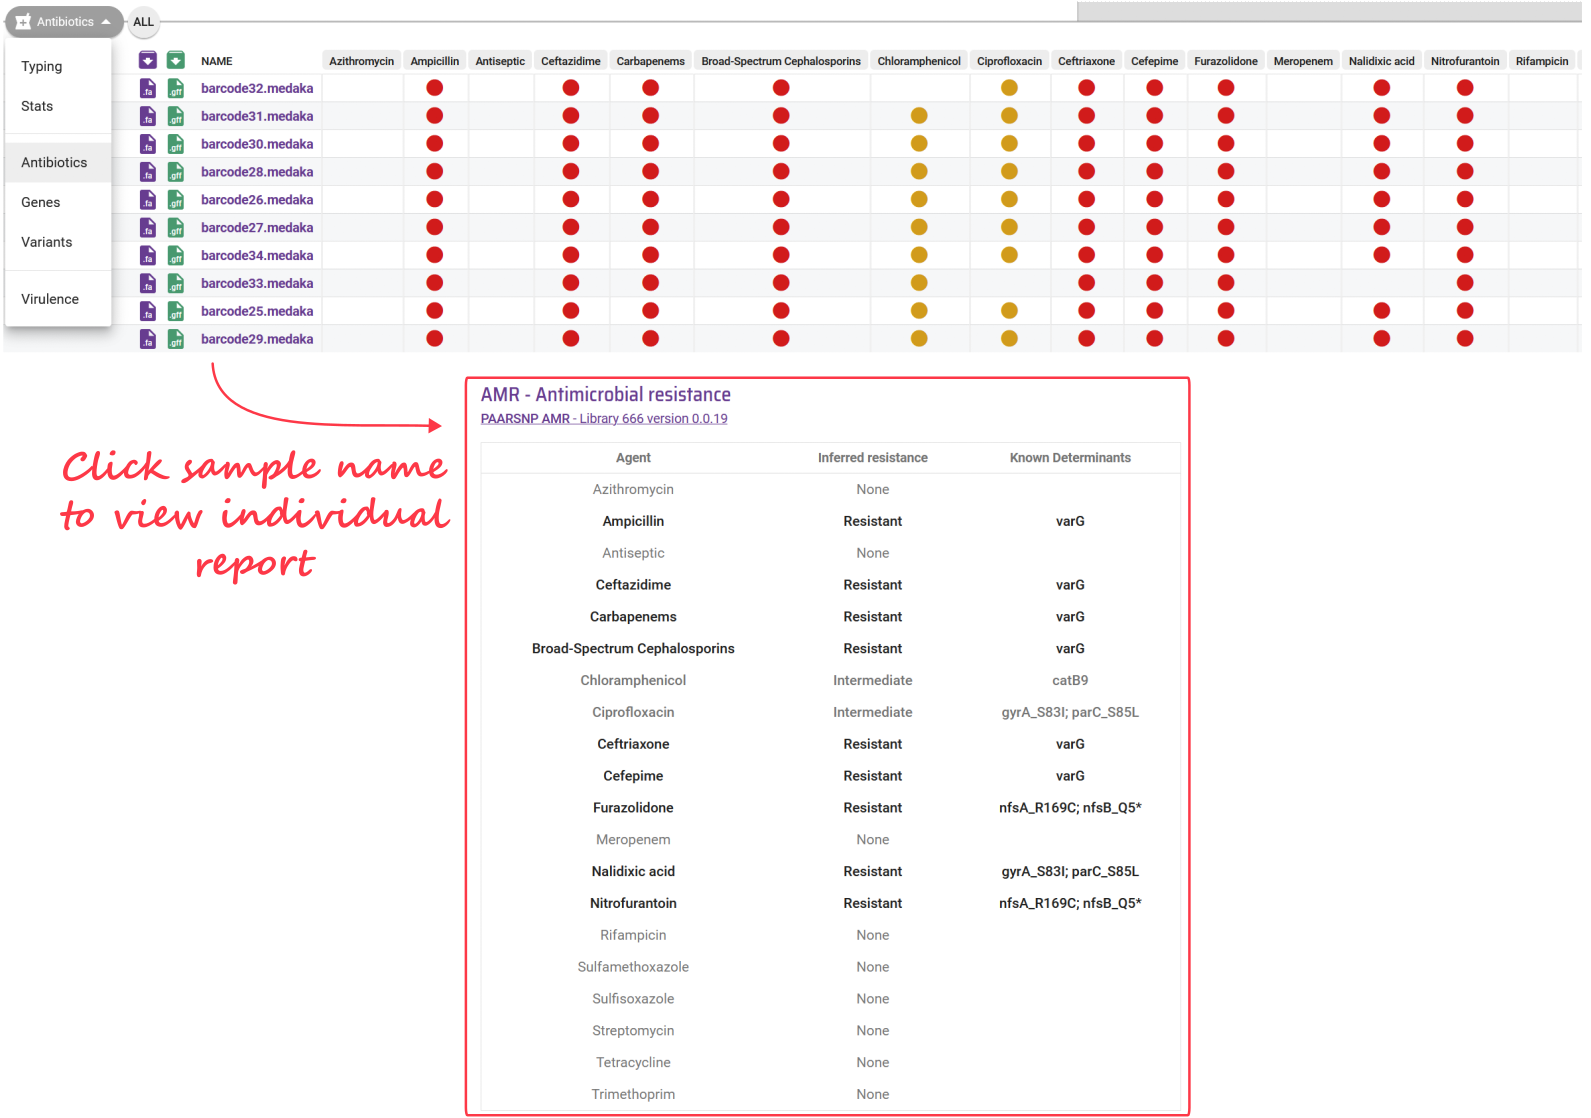
Pathogenwatch also performs AMR prediction using its own algorithm and curated gene sequences. The results from this analysis can be seen from the individual sample report, or summarised in the collection view.
13.4 Which AMR do my isolates have?
At this stage you may notice that different tools will give you a different answer to this question and it is therefore recommended to compare the results across multiple tools. For example, Pathogenwatch generally detects AMR for comparatively more antimicrobial drugs compared to the funcscan analysis. However, some of the drugs detected by funcscan were either not reported by Pathogenwatch (possibly because they are not part of its database) or have a disagreeing result.
Let’s take a specific example. Pathogenwatch determined that none of our isolates were resistant to Streptomycin. However, in the hAMRonization summary table (output by funcscan) we can see that this drug was reported for several of our samples. Upon closer inspection, however, we can see that we only had partial matches to the reference NCBI sequence (WP_001206356.1), or in the case of one sample with a higher match the sequence identity was less than 100% (table below, showing some of the columns from the hAMRonization table).
input_file_name               gene_symbol   reference_accession   antimicrobial_agent   coverage_percentage   sequence_identity
isolate01.tsv.amrfinderplus   aadA2         WP_001206356.1        STREPTOMYCIN          68.44                 100
isolate02.tsv.amrfinderplus   aadA2         WP_001206356.1        STREPTOMYCIN          68.44                 100
isolate02.tsv.amrfinderplus   aadA2         WP_001206356.1        STREPTOMYCIN          68.44                 100
isolate04.tsv.amrfinderplus   aadA2         WP_001206356.1        STREPTOMYCIN          68.44                 100
isolate05.tsv.amrfinderplus   aadA2         WP_001206356.1        STREPTOMYCIN          68.44                 100
isolate06.tsv.amrfinderplus   aadA2         WP_001206356.1        STREPTOMYCIN          68.44                 100
isolate07.tsv.amrfinderplus   aadA2         WP_001206356.1        STREPTOMYCIN          68.44                 100
isolate08.tsv.amrfinderplus   aadA2         WP_001206356.1        STREPTOMYCIN          68.44                 100
isolate09.tsv.amrfinderplus   aadA2         WP_001206356.1        STREPTOMYCIN          68.44                 100
isolate10.tsv.amrfinderplus   aadA2         WP_001206356.1        STREPTOMYCIN          100                   92.05
It is also important to take into consideration our earlier assembly quality assessments as they may result in false negative results. For example, we can see that “isolate05” has the lowest AMR detection of all samples. However, this was the sample with the lowest genome coverage (only 21x) and with a resulting highly fragmented genome (229 fragments). Therefore, it is very possible that we missed parts of its genome during assembly, and that some of those contained AMR genes or plasmids.
In conclusion, always be critical of the analysis of your results at this stage, comparing the output from different tools as well as considering the quality of your assemblies. Ultimately, the safest way to assess AMR is with experimental validation, by testing those strains against the relevant antimicrobial agents in the lab. However, computational analysis such as what we did can help inform these experiments and treatment decisions.
13.5 Exercises
For these exercises, you can either use the dataset we provide in Data & Setup, or your own data. You also need to have completed the genome assembly exercise in Section 8.4.
Following from the Pathogenwatch exercise in Section 10.4, open the “Ambroise 2023” collection that you created and answer the following questions:
- Open the antibiotics summary table.
- Do all your samples have evidence for antibiotic resistance?
- If any samples have resistance to much fewer antibiotics compared to the others, do you think this could be related to assembly quality?
- How do the results from Pathogenwatch compare to those from
nf-core/funcscan?
How do the results compare with Pathogenwatch?
We can open the “Antibiotics” table from the top-left dropdown menu, as shown in the image below.
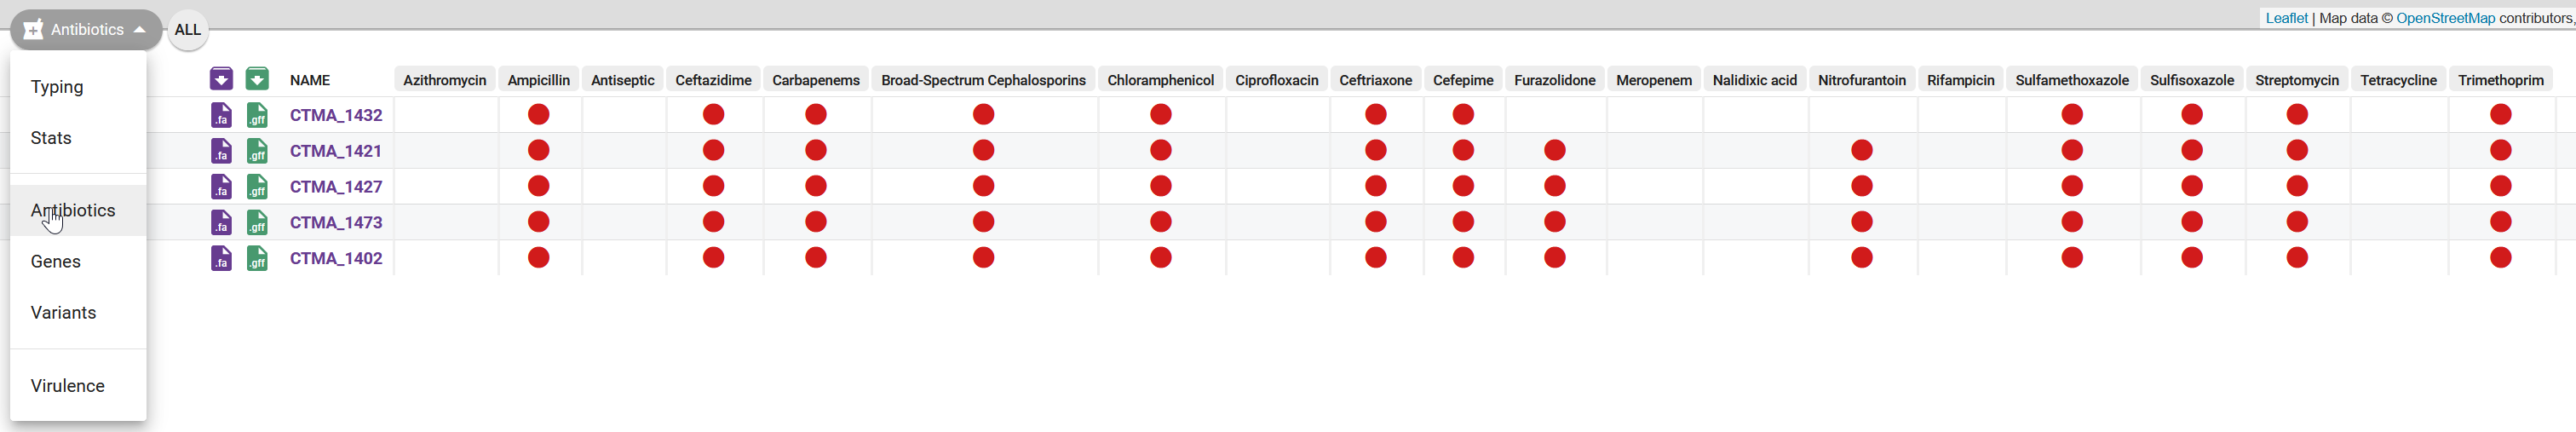
We can see that Pathogenwatch identified resistance to several antibiotics. All samples are similar, except “1432” doesn’t have resistance to furazolidone and nitrofurantoin. This sample had high completeness, according to CheckM2. However, it was also the sample with the lowest sequencing coverage (from our analysis during the genome assembly in Section 8.4), so this could be a “false negative” result due to the inability to cover some of the genes that confer AMR.
All of the drugs identified by funcscan were also identified by Pathogenwatch (note that sulfamethoxazole and sulfisoxazole identified by Pathogenwatch are both sulfonamide-derived drugs, reported by funcscan). However, Pathogenwatch identified resistance to several other drugs: ampicilin, ceftazidime, cephalosporins, ceftriazone, cefepime, furazolidone and nitrofurantoin.
13.6 Summary
- AMR poses significant global public health threats by diminishing the effectiveness of antibiotics, making it challenging to treat infectious diseases effectively.
- AMR software aims to identify specific genes or mutations known to confer resistance to antimicrobial agents. These tools compare input genetic sequences to known resistance genes or patterns in their associated databases.
- The
nf-core/funcscanworkflow performs AMR analysis using several software tools and producing a summary of their results as a CSV file. - Pathogenwatch is a more user-friendly application, which performs AMR using its own curated database.
- AMR prediction can result in false results (either false positives or false negatives). One way to overcome this limitation is to compare the results from multiple tools and, whenever possible, complement it with validation assays in the lab.